
How to Trace Predecessors and Successors
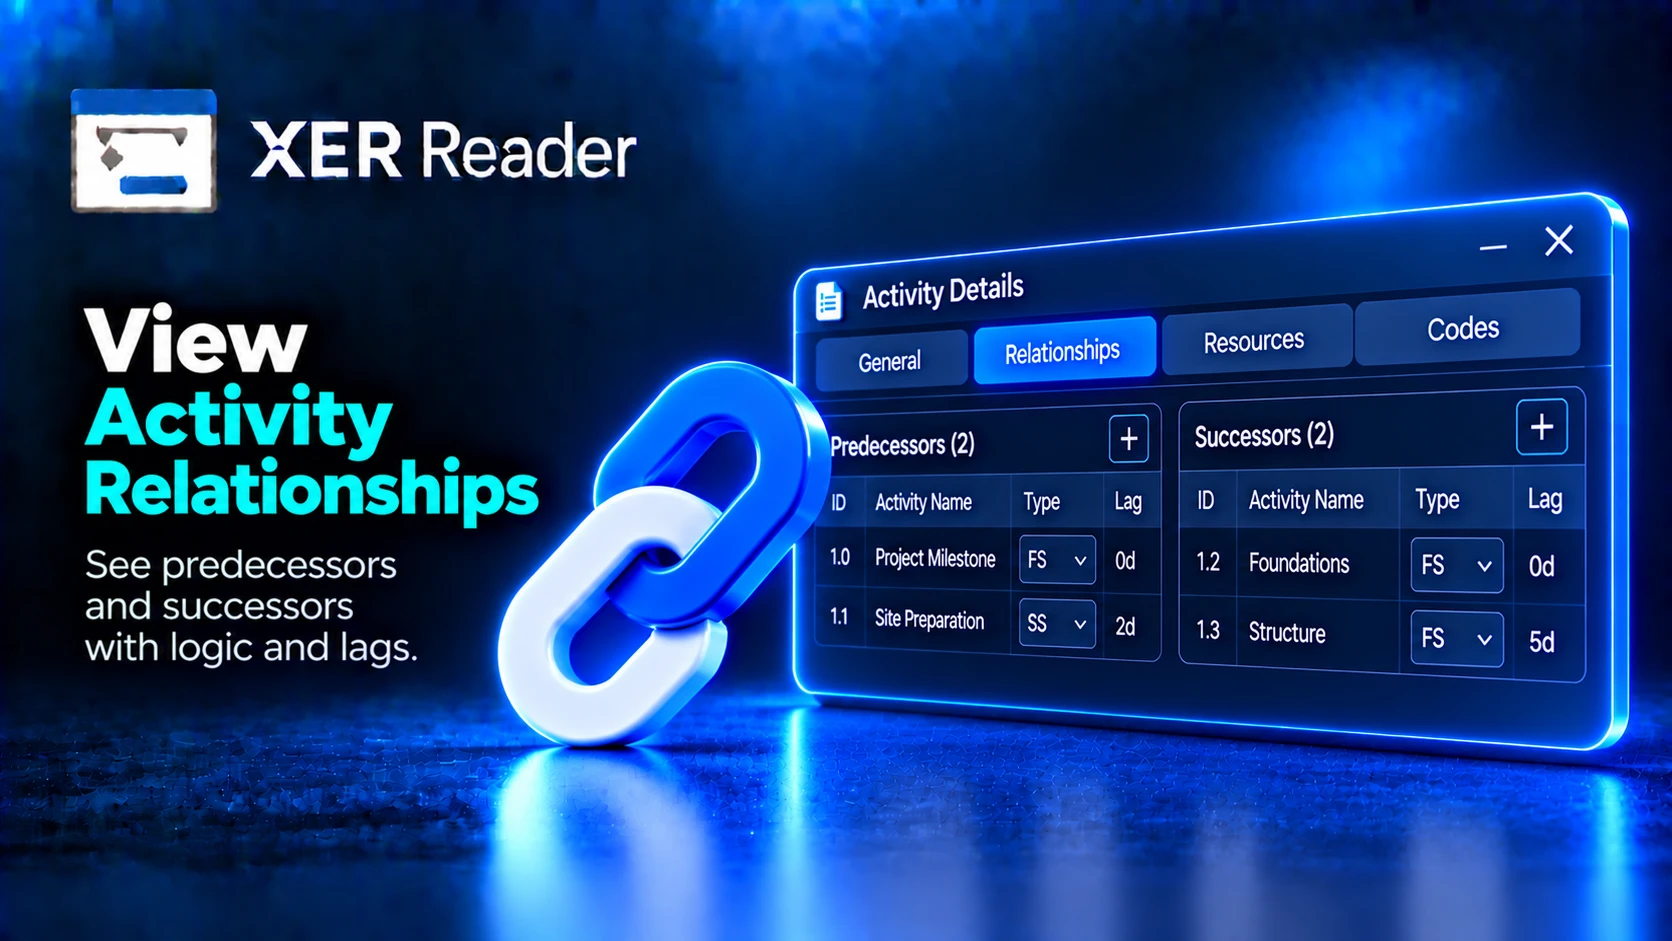
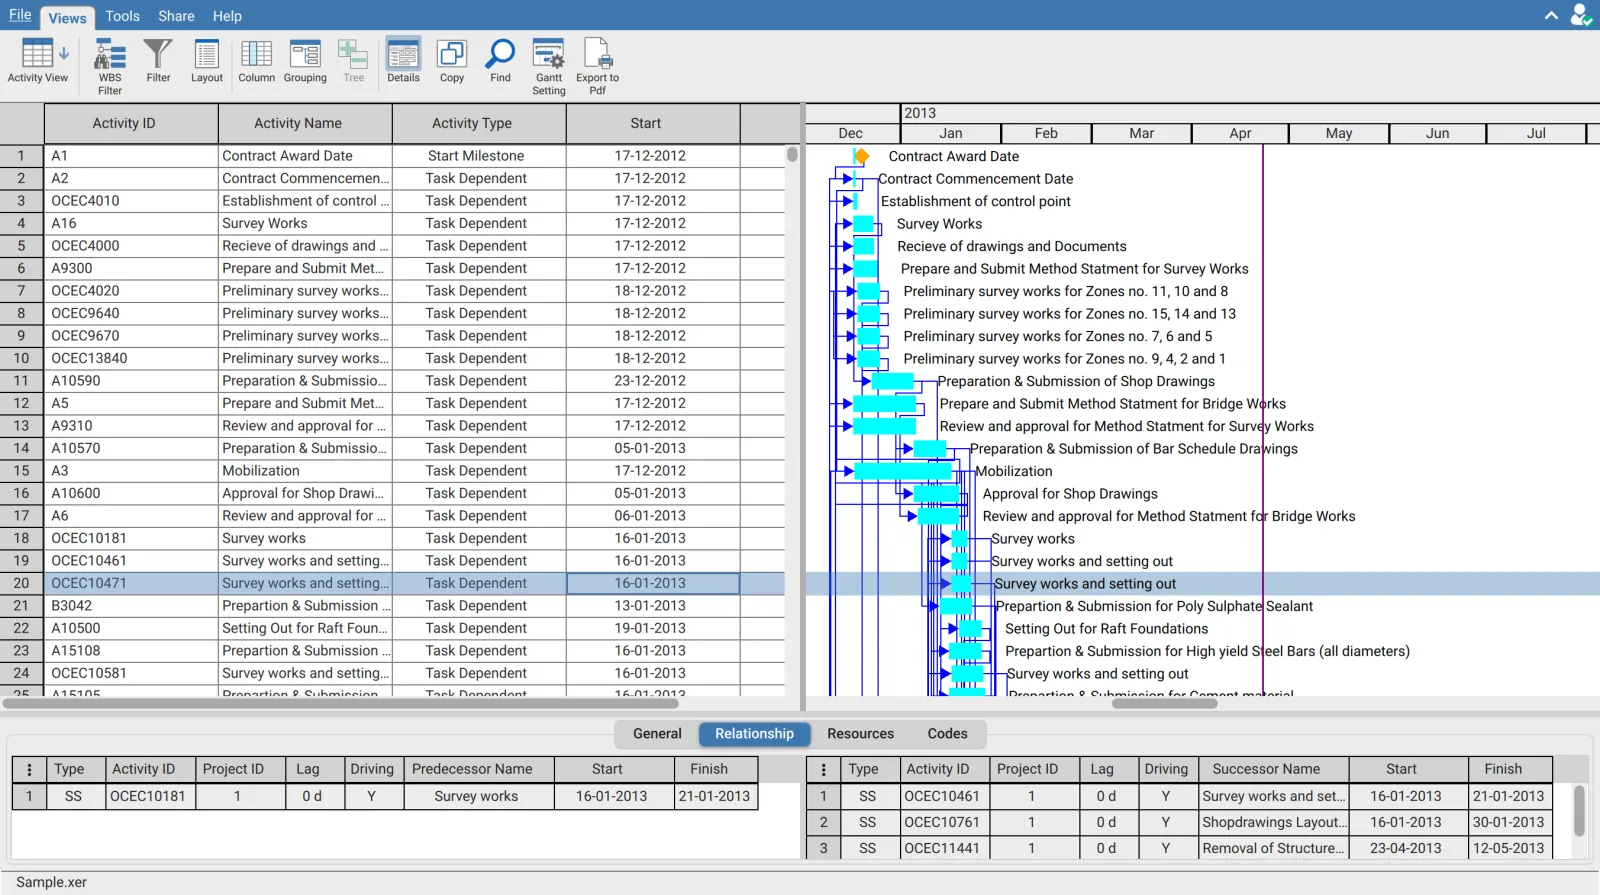
The Relationship tab shows the logic around the selected activity in two tables, predecessors and successors.
| Table | Contains | Answers |
|---|---|---|
| Predecessors | Activities that must happen before this one | Why can this activity not start earlier |
| Successors | Activities waiting on this one | What slips if this activity slips |
What the columns tell you
| Column | Meaning |
|---|---|
| Type | The relationship type, such as FS, SS, FF or SF |
| Activity ID and name | The activity at the other end of the relationship |
| Lag | Delay applied to the relationship, in days |
| Driving | Whether this relationship is the one controlling the activity's dates |
| Project ID | Which project the related activity belongs to, for logic that crosses projects |
| Start and Finish | The related activity's dates |
Driving is the column that matters
An activity can have many predecessors while only one controls its dates. The Driving flag identifies it. Following the driving predecessor back, activity by activity, traces the controlling path by hand and is how a critical path is verified rather than taken on trust.
An activity with total float of zero and no driving predecessor is usually held by a constraint rather than by logic. That is worth checking whenever a critical path looks wrong.
Lag and relationship type together
A finish to start relationship with a long lag behaves like an activity with no name and no owner. Reviewing type and lag together across the predecessor list is the quickest way to find hidden duration that no one is accountable for.
Choosing columns
Each table has its own column chooser, Manage Predecessor Columns and Manage Successor Columns. They are independent, so the predecessor table can show lag and driving for tracing logic while the successor table shows only IDs and names.
Column choices are remembered. Closing the panel, selecting a different activity, or switching views and returning all keep the layout you set.
Navigating the logic
Selecting a row in either table moves the table selection to that activity, and the panel follows. A chain of logic can be walked one step at a time without leaving the panel or losing your place.
To see the same relationships drawn rather than listed, use the Network Diagram view, which emphasises what depends on what rather than when things happen.