
How to Connect a BI Tool with BI Connect
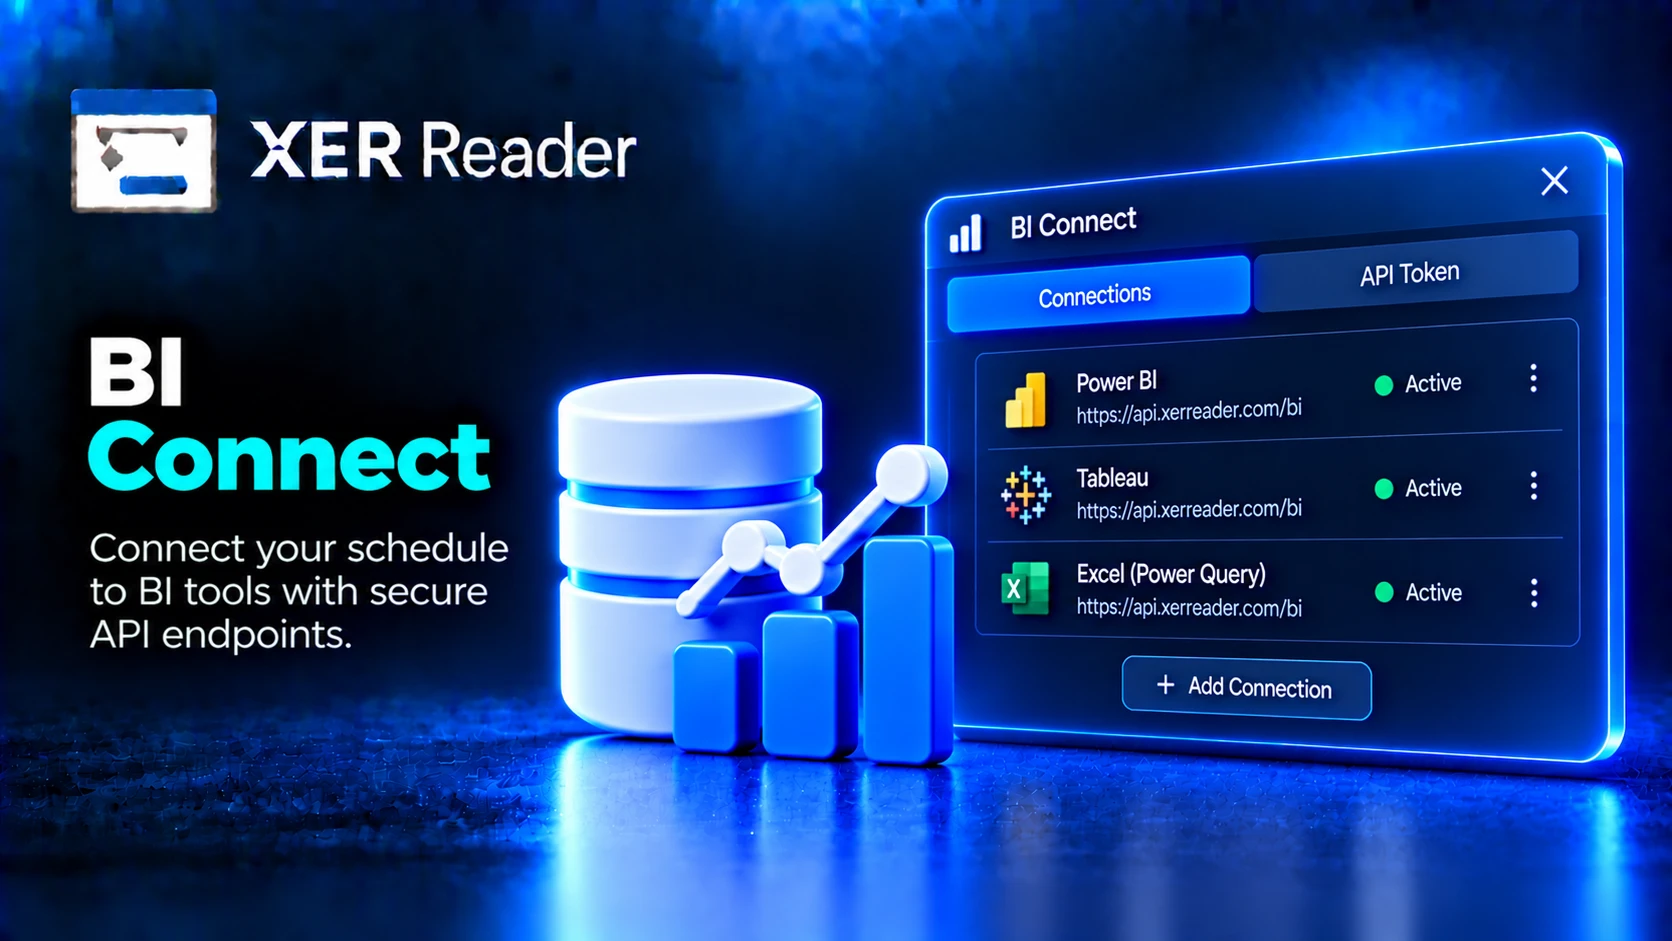
BI Connect exposes an open project's converted database as a REST API. A BI tool queries it with standard SQL SELECT statements over HTTP, so Power BI, Google Sheets or any HTTP client can read schedule data without a file being sent anywhere.
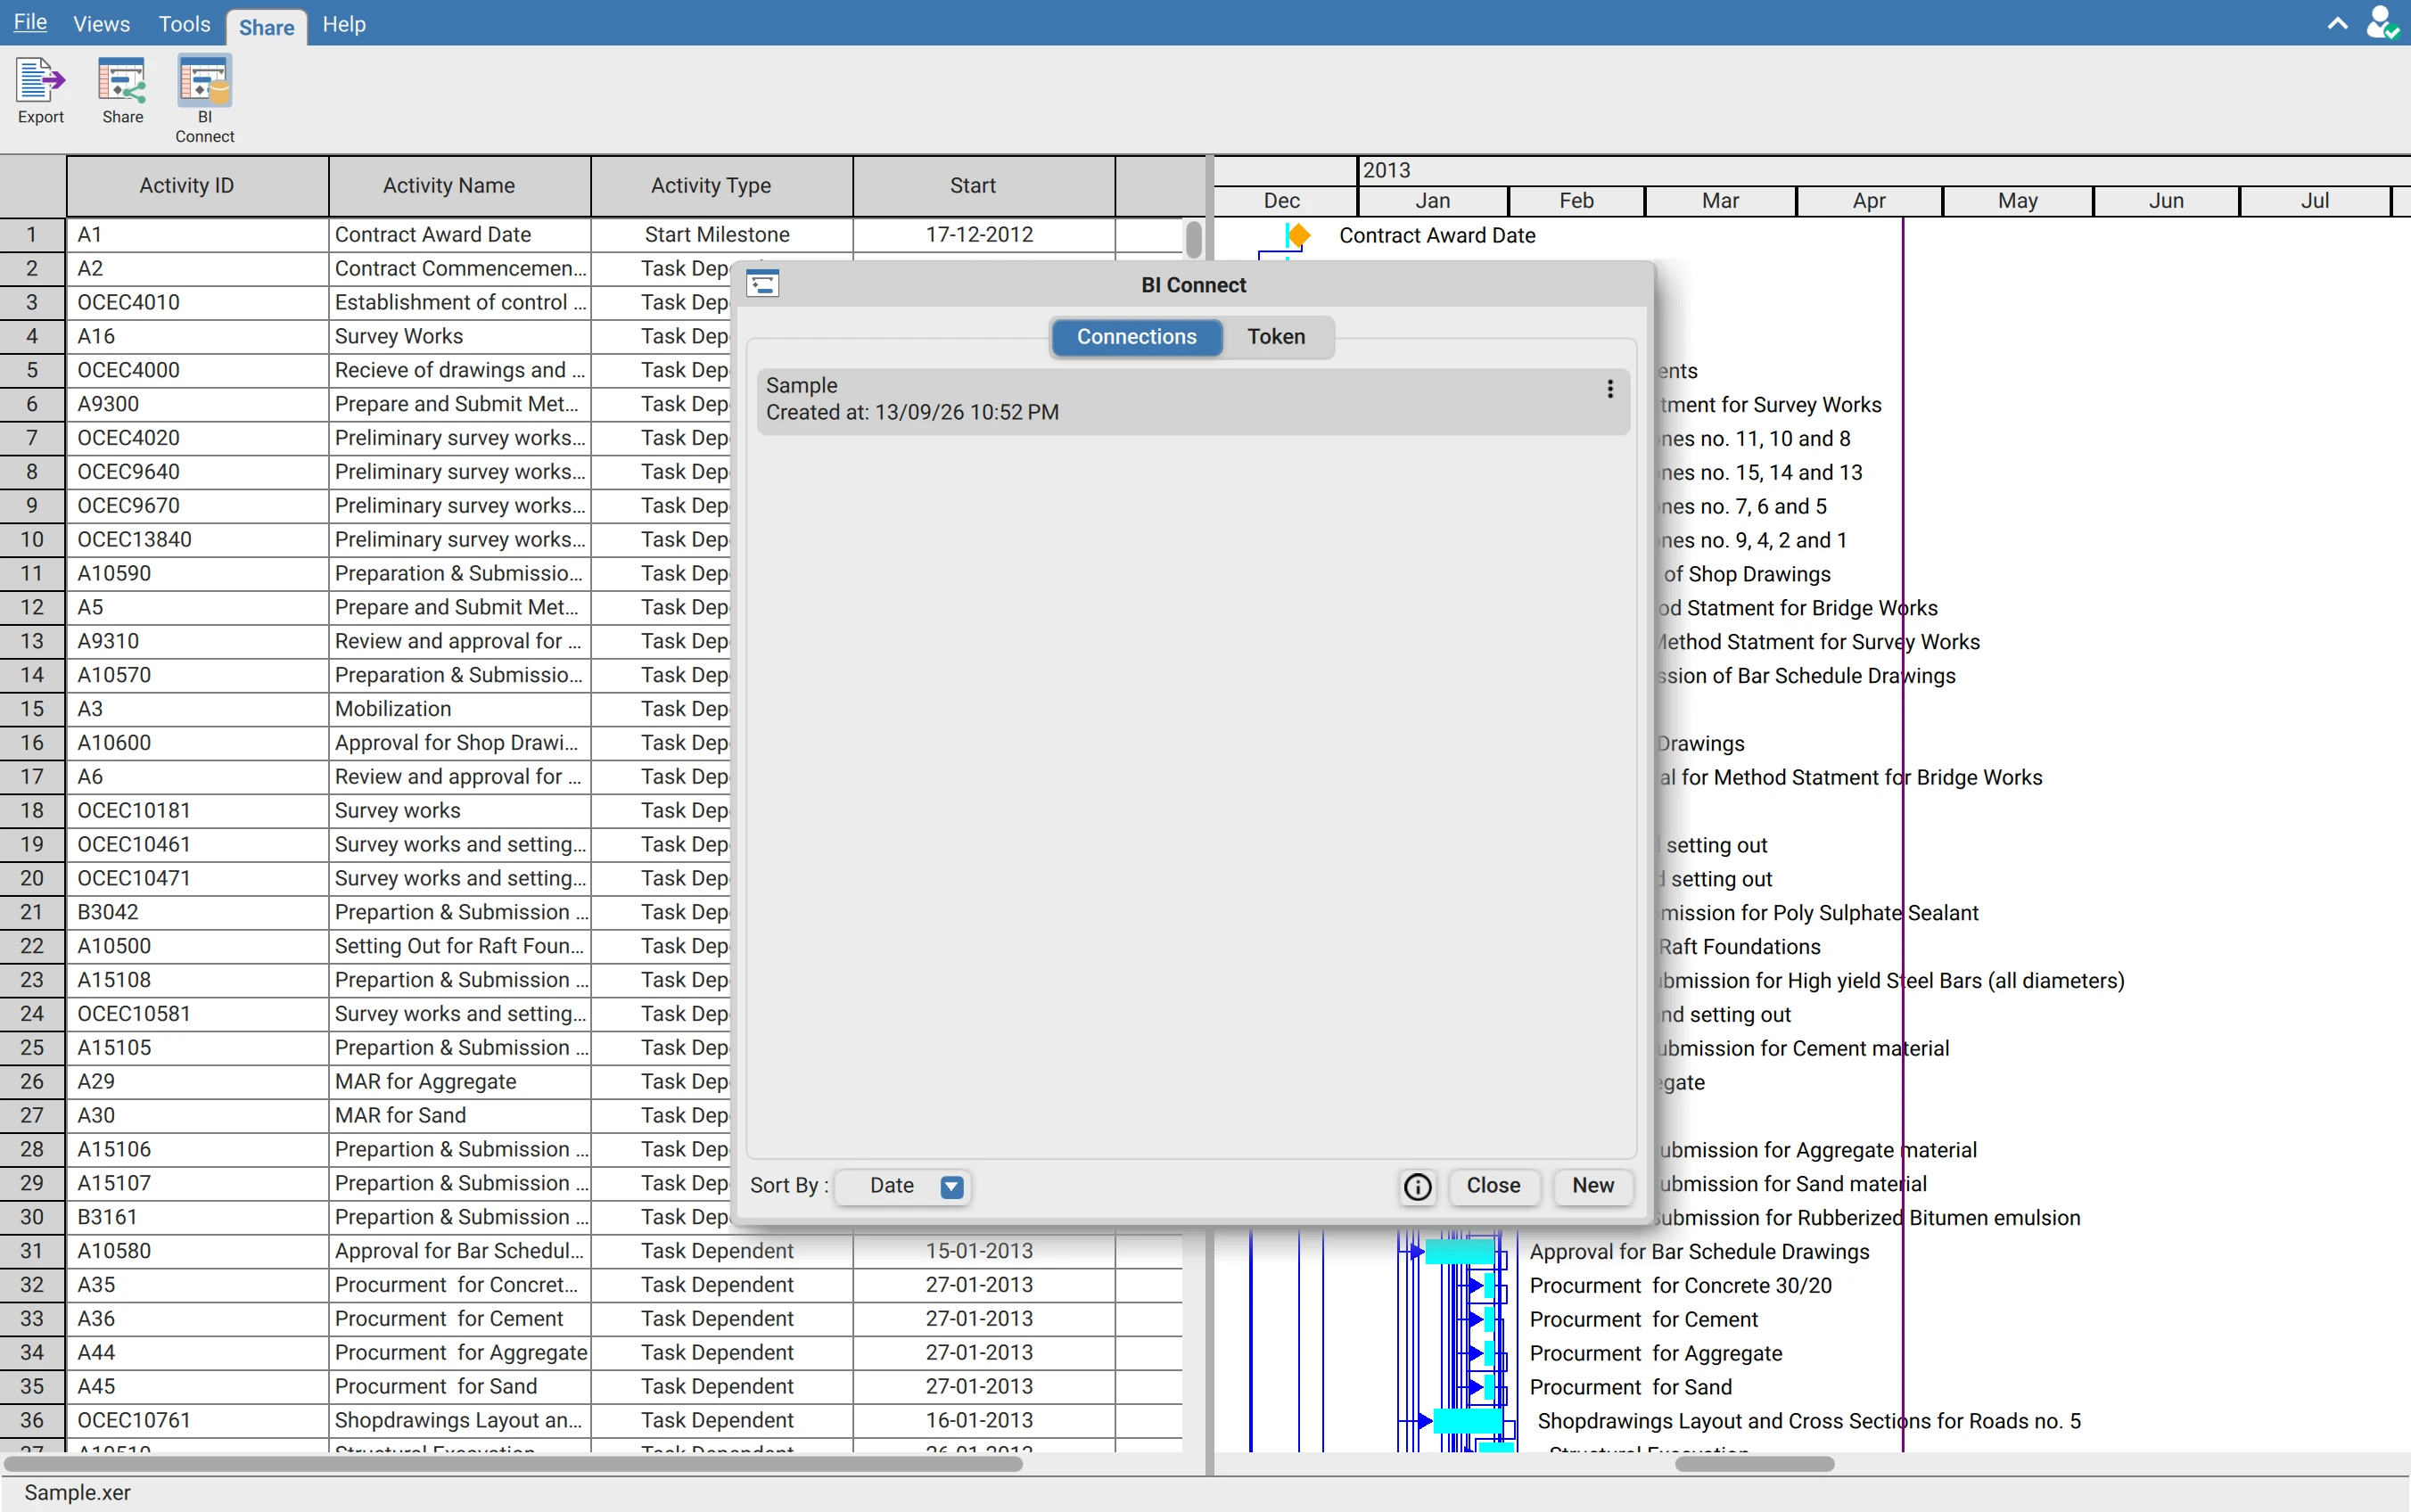
How the pieces fit
| Piece | What it is |
|---|---|
| Connection | One database exposed over REST. A connection can be created for any open project file, and each has its own Connection ID |
| Token | A single credential that authenticates every connection on your account, not one per connection |
| Query endpoint | Where the BI tool sends SQL and receives rows |
| Tables endpoint | Lists the tables available in that connection with their row counts |
Create the token first
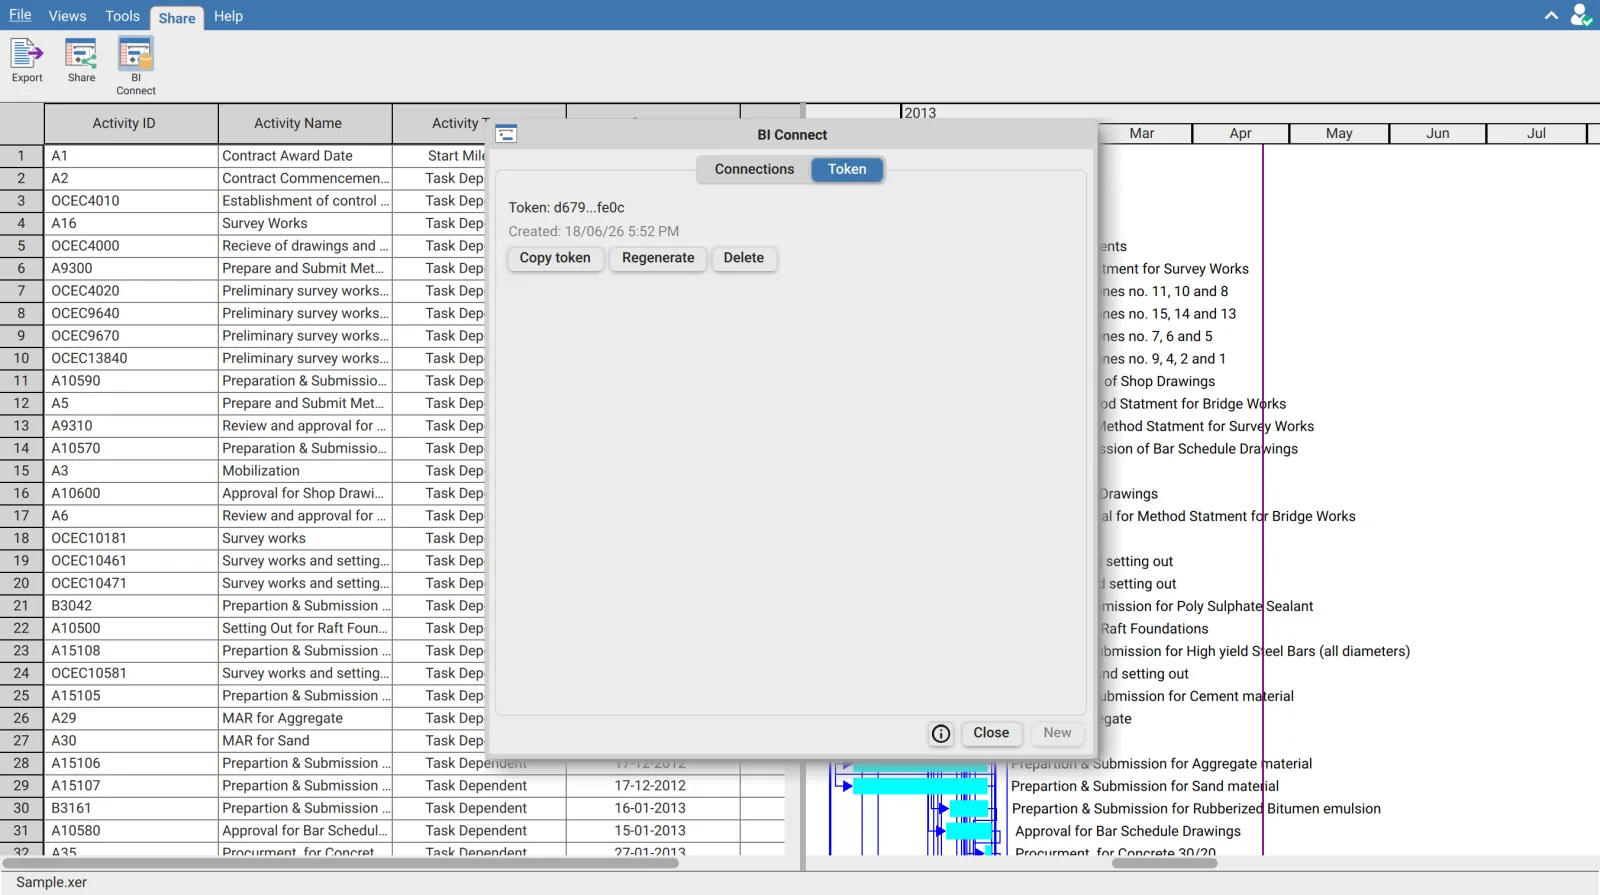
The token is on its own tab and must exist before any URL can be copied. Attempting to copy a URL without one is refused with a message telling you to create the token first.
| Control | Effect |
|---|---|
| Create token | Creates the token. Shown when none exists |
| Regenerate | Replaces the token. Shown once one exists |
| Copy token | Places the token on the clipboard |
| Delete | Removes the token |
The tab shows a preview of the token and the date it was created. Where no token exists it states so instead.
Regenerating invalidates the old token immediately. Every report, sheet and script already using it stops working at that moment, because one token serves all your connections. Regenerate when the token has leaked, and plan to update every consumer at the same time.
Create a connection
Open the project you want to expose.
On the Share tab, click BI Connect, then New.
Type a Name and click Create. The schedule is prepared and uploaded, which takes a moment on a large project.
If preparation or upload fails the dialog reports it and no connection is created. Retry rather than assuming a partial connection exists.
Querying data
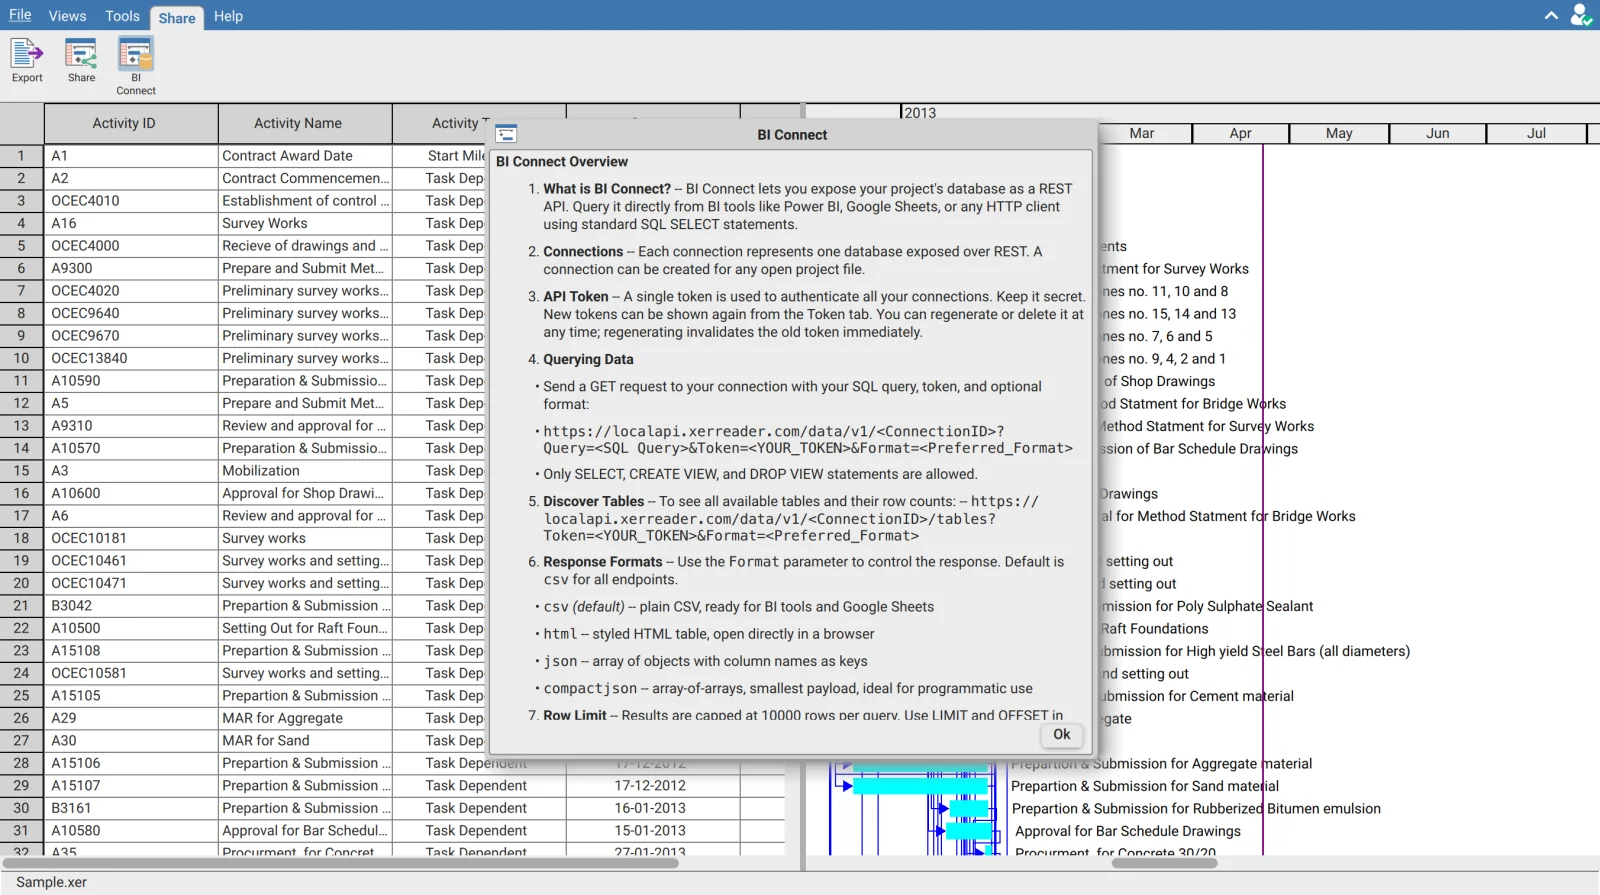
A query is a GET request carrying the SQL, the token and an optional format.
Copy sample URL puts this on the clipboard with your real token already substituted, which is the quickest way to get a working request into a BI tool.
Only read statements are accepted
The endpoint accepts SELECT, CREATE VIEW and DROP VIEW and nothing else. A connection cannot be used to modify schedule data, which is what makes it safe to hand to a reporting team.
CREATE VIEW is the useful one. A view defined once against a connection turns a complicated join into a named table the BI tool can read directly, which keeps the SQL out of the report.
Discovering the tables
Before writing a query you need to know what is there. The tables endpoint lists every available table with its row count.
Copy tables URL copies it with the token substituted. Start here when building a data model, rather than guessing table names.
Response formats
The Format parameter controls what comes back. All endpoints default to csv.
| Format | Returns | Use when |
|---|---|---|
| csv | Plain CSV | Feeding a BI tool or Google Sheets. This is the default |
| html | A styled HTML table | Checking a query by opening the URL in a browser |
| json | An array of objects with column names as keys | Scripting, where readable field names matter |
| compactjson | An array of arrays | Scripting at volume. The smallest payload of the four |
The row limit
Results are capped at 10,000 rows per query. Use LIMIT and OFFSET in the SQL to page through anything larger.
A response includes a truncated field indicating whether the cap was reached. Check it rather than assuming a full result, because a report reading a capped response looks complete and is not.
Managing connections
| Action | Effect |
|---|---|
| Update with current | Refreshes the connection with the schedule as it now stands |
| Rename | Changes the name in your list |
| Edit | Changes the connection settings |
| Copy sample URL | Copies a query endpoint with the token substituted |
| Copy tables URL | Copies the table listing endpoint with the token substituted |
| Background color | Colours the entry so connections are distinguishable at a glance |
| Unset color | Removes that colour |
| Delete | Revokes the connection |
Sort By orders the list when several connections exist.
A connection is a snapshot
A connection serves the schedule as it was when created or last updated. A BI report refreshing against it re-reads the same data and does not pick up a progress update until Update with current is used. A dashboard can otherwise look current while reporting an old programme, which is the failure mode worth guarding against on a monthly reporting cycle.
BI Connect compared with the alternatives
| BI Connect | Export to SQLITE | Share link | |
|---|---|---|---|
| Delivery | A REST API the tool queries | A file you send | A page a person opens |
| Audience | A BI tool | Anyone with the file | A person |
| Refresh | The tool re-reads the connection | A new file each time | Update with current |
| Access control | A token you can revoke | None once the file is sent | Delete the share, optional password |
| Query language | SQL over HTTP | SQL against the file | None |
The token is a credential. Anyone holding it can read every connection on your account. Do not paste it into shared documents, tickets or chat, and delete connections that are no longer in use.
Requirements
Requires a signed in account entitled to API sharing. Unavailable in shared mode.