
How to Read the Resource Usage Spreadsheet
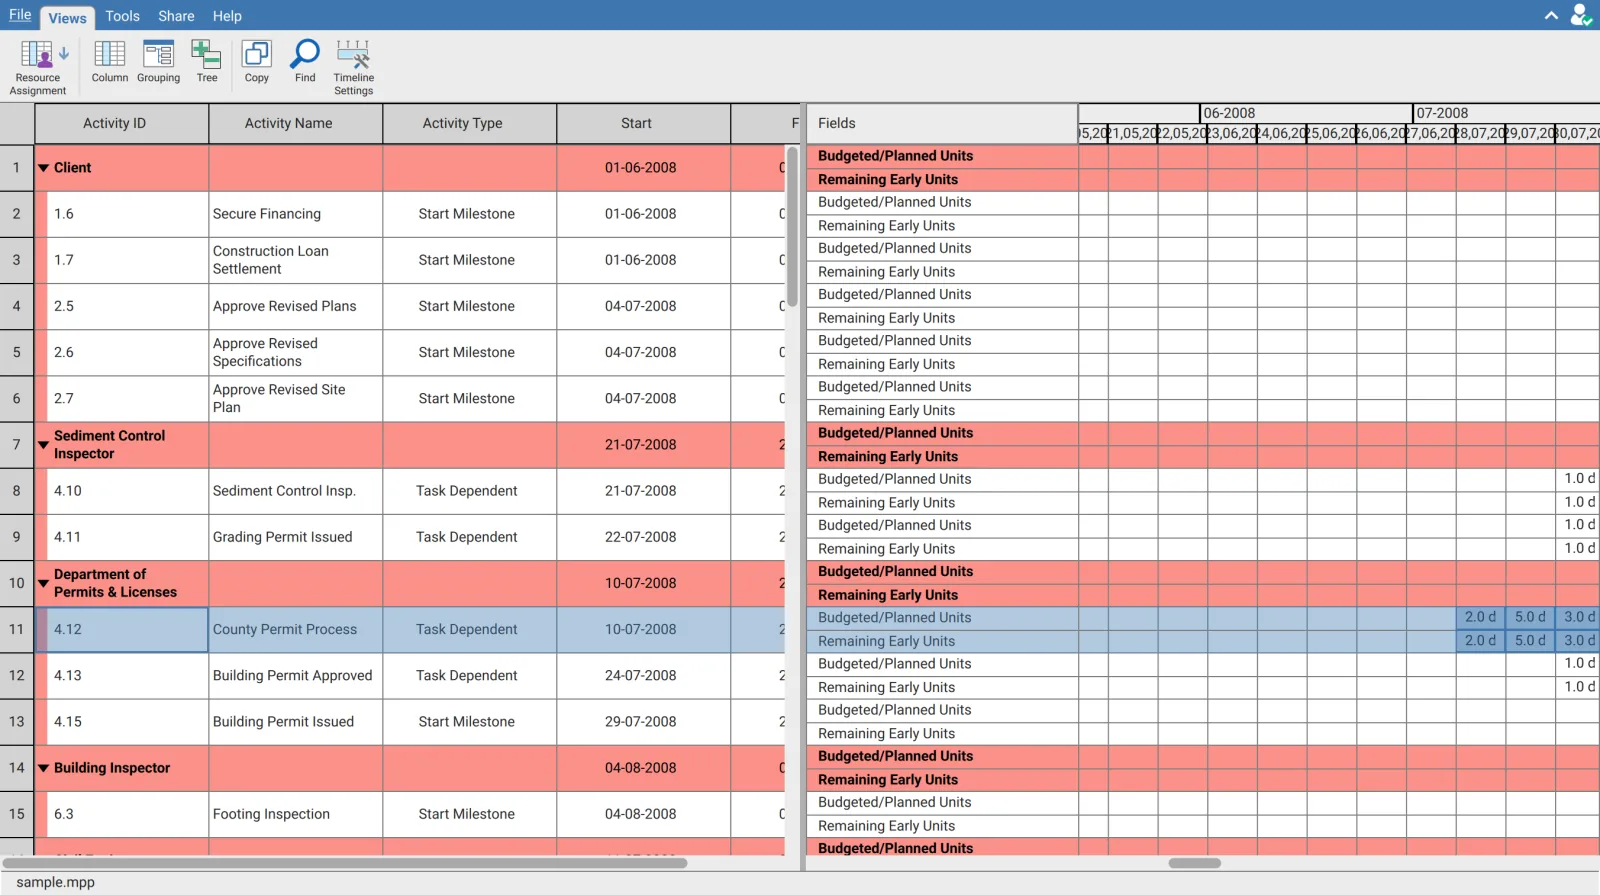
The right hand pane of the Resource Assignment view is a spreadsheet, not a chart. Every cell holds the units falling in one period, and the pane has its own selection, its own clipboard and its own navigation, all separate from the activity table beside it.
How the grid is built
Rows come from the activity tree on the left, and each activity contributes two of them. Columns come from the bottom row of the time scale. A cell is therefore one field of one assignment in one period.
| Row | Holds |
|---|---|
| Budgeted/Planned Units | The units planned for the assignment in that period |
| Remaining Early Units | The units still to be done in that period |
The two rows are why the activity rows in the left table are twice the usual height. Both panes scroll together vertically, and the row heights are kept in step so the two halves never drift apart.
The Fields column
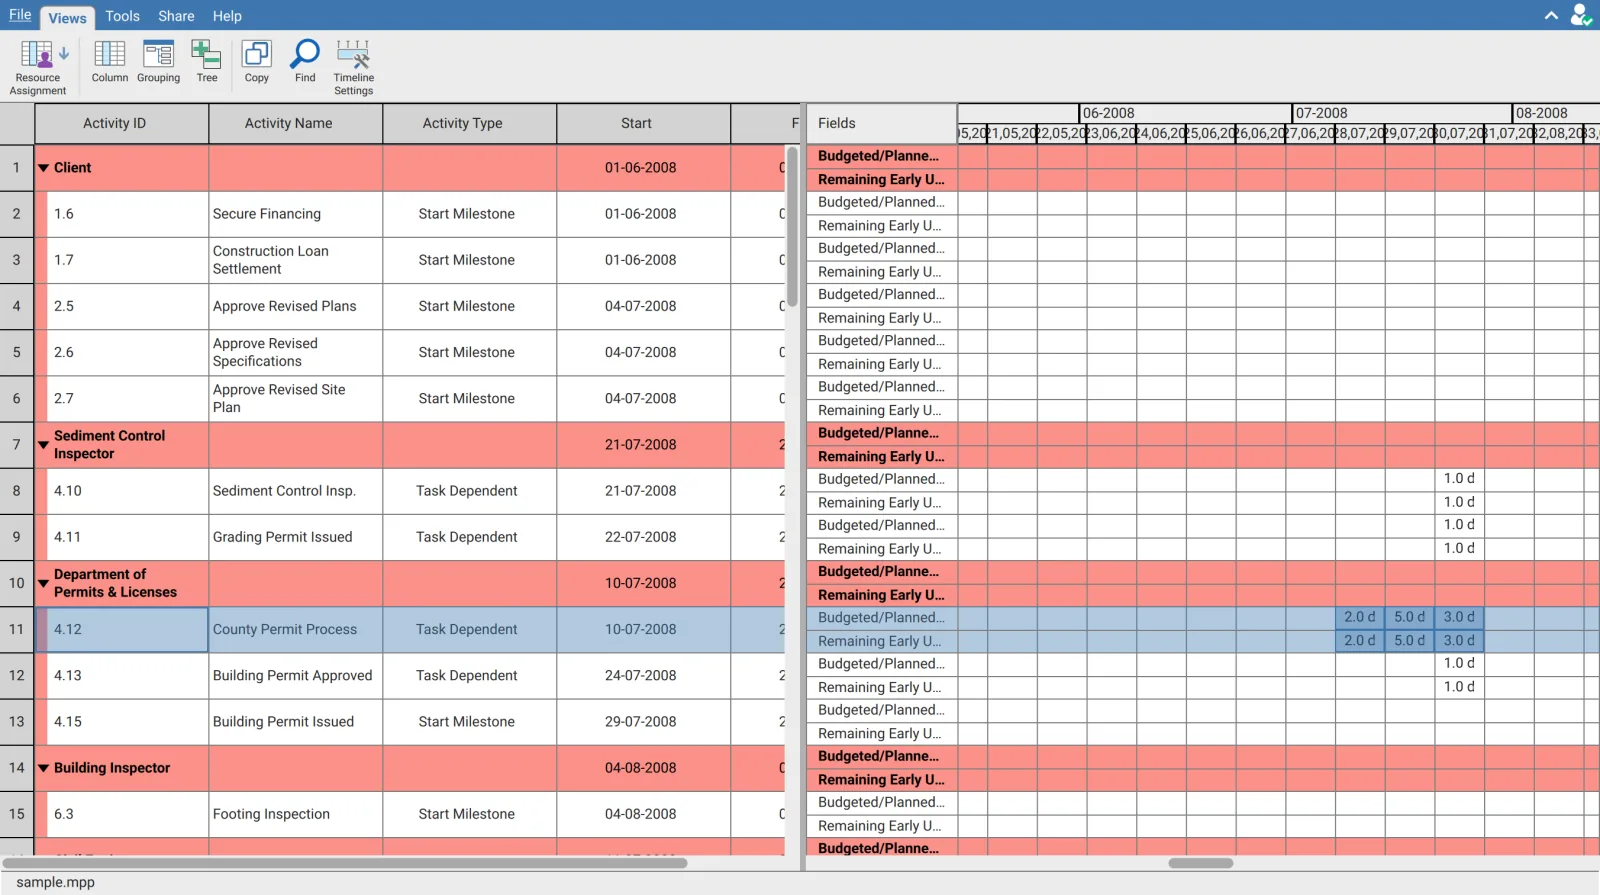
The divider between the Fields column and the time scale drags, and the pointer changes to a horizontal resize arrow over it. The labels are elided to fit, so at the default width they read as Budgeted/Planned... and Remaining Early U...; widening the column shows them in full.
The drag is clamped at both ends. The Fields column cannot be narrowed past a minimum, and it cannot be widened past the point where the time scale would lose its own minimum width. Dragging to the far edge parks it at the limit rather than collapsing either side.
Reading a cell
A value is the units falling inside that period, to one decimal place, with the time unit abbreviation after it. A period with no units shows nothing at all.
Blank is not zero. Empty cells are left empty on purpose, so the periods that carry work stand out along the row. Do not read a blank run as a gap in the data; it is a gap in the allocation.
| Setting | Where it comes from |
|---|---|
| The number | The assignment, spread across the period the column covers |
| The unit and its abbreviation | Tools then Settings, under time unit |
| The period a column covers | Timeline Settings, bottom row unit |
Changing the bottom row unit from Day to Week or Month does not change the totals, only how they are gathered. The same assignment reads as five daily cells or one weekly cell.
Group bands carry no totals
A resource band shows no rolled up figure. The band rows are drawn with the grid and nothing else: no sum of the activities under them, in any period. To total a resource you have to read its activity rows, or take the numbers out to a spreadsheet. This is the one thing people expect from a usage view that this pane does not do.
Selecting cells
Click a cell to select it. That also selects the matching row in the activity table, so the two panes stay on the same activity.
Hold Shift and click a second cell to take the rectangle between the two. The block spans both field rows and as many periods as it covers, and it can run across several activities.
| Action | Result |
|---|---|
| Click | Selects one cell and the activity row beside it |
| Shift and click | Extends the selection to a rectangle from the first cell |
| Tab | Moves the selection one cell right, wrapping to the start of the next row |
| Shift and Tab | Moves it one cell left, wrapping to the end of the previous row |
| Escape | Clears the selection |
Walking with Tab scrolls the pane to keep the selected cell in view, horizontally and vertically, so the selection cannot disappear off the edge. At the last cell of the last row it wraps back to the first.
The selection is dropped whenever the grid underneath it changes: a different number of rows, a reset model, or a change to the time scale that alters the number of columns. That is deliberate, because the cells the old rectangle pointed at are no longer the same cells.
Copying the numbers out
A selected block copies to the clipboard with the standard copy command. What lands is tab separated text, one line per field row and one column per period, which pastes into a spreadsheet with the periods across the top.
Copy on the ribbon is a different copy. It takes the selected rows of the activity table on the left, the columns of activity data. The units in the time scale only come out through the cell selection described here. If a paste arrives with activity names and no numbers, the ribbon button was used instead of the cell block.
The copy reads the values the same way the pane draws them, so what you paste matches what you saw, blanks included.
Jumping to where the work is
Double click a row in the time scale pane and it scrolls to the first period that has a value for that assignment. On a schedule running over years, with the columns set to days, that is the difference between finding an allocation and giving up on the scroll bar. Nothing on screen advertises it.
The jump animates rather than snapping, and it lands the first populated period a little in from the left edge so the run of work after it is visible. It looks at both field rows and goes to whichever starts earlier. An assignment with no units anywhere does not move the view.
Expanding and collapsing
Expansion belongs to the activity table on the left. The time scale pane deliberately does not respond to clicks on the expand arrows, because toggling a row in only one of the two panes would let them fall out of step.
The view opens with every band expanded.
Resizing the periods
The time scale header resizes by dragging, which widens or narrows the columns in place and is the quickest way to fit more periods on screen without opening a dialog. The same width is what Size in Timeline Settings sets, so a drag and the slider are two routes to one setting.
Requirements
Part of the Resource Assignment view, so it requires an open schedule with resource assignments and a signed in account.