
How to Read the S-Curve
The S-Curve plots Planned Value, Earned Value and Actual Cost over time and gives the earned value figures at the data date. Pick it from the view button on the Views tab.
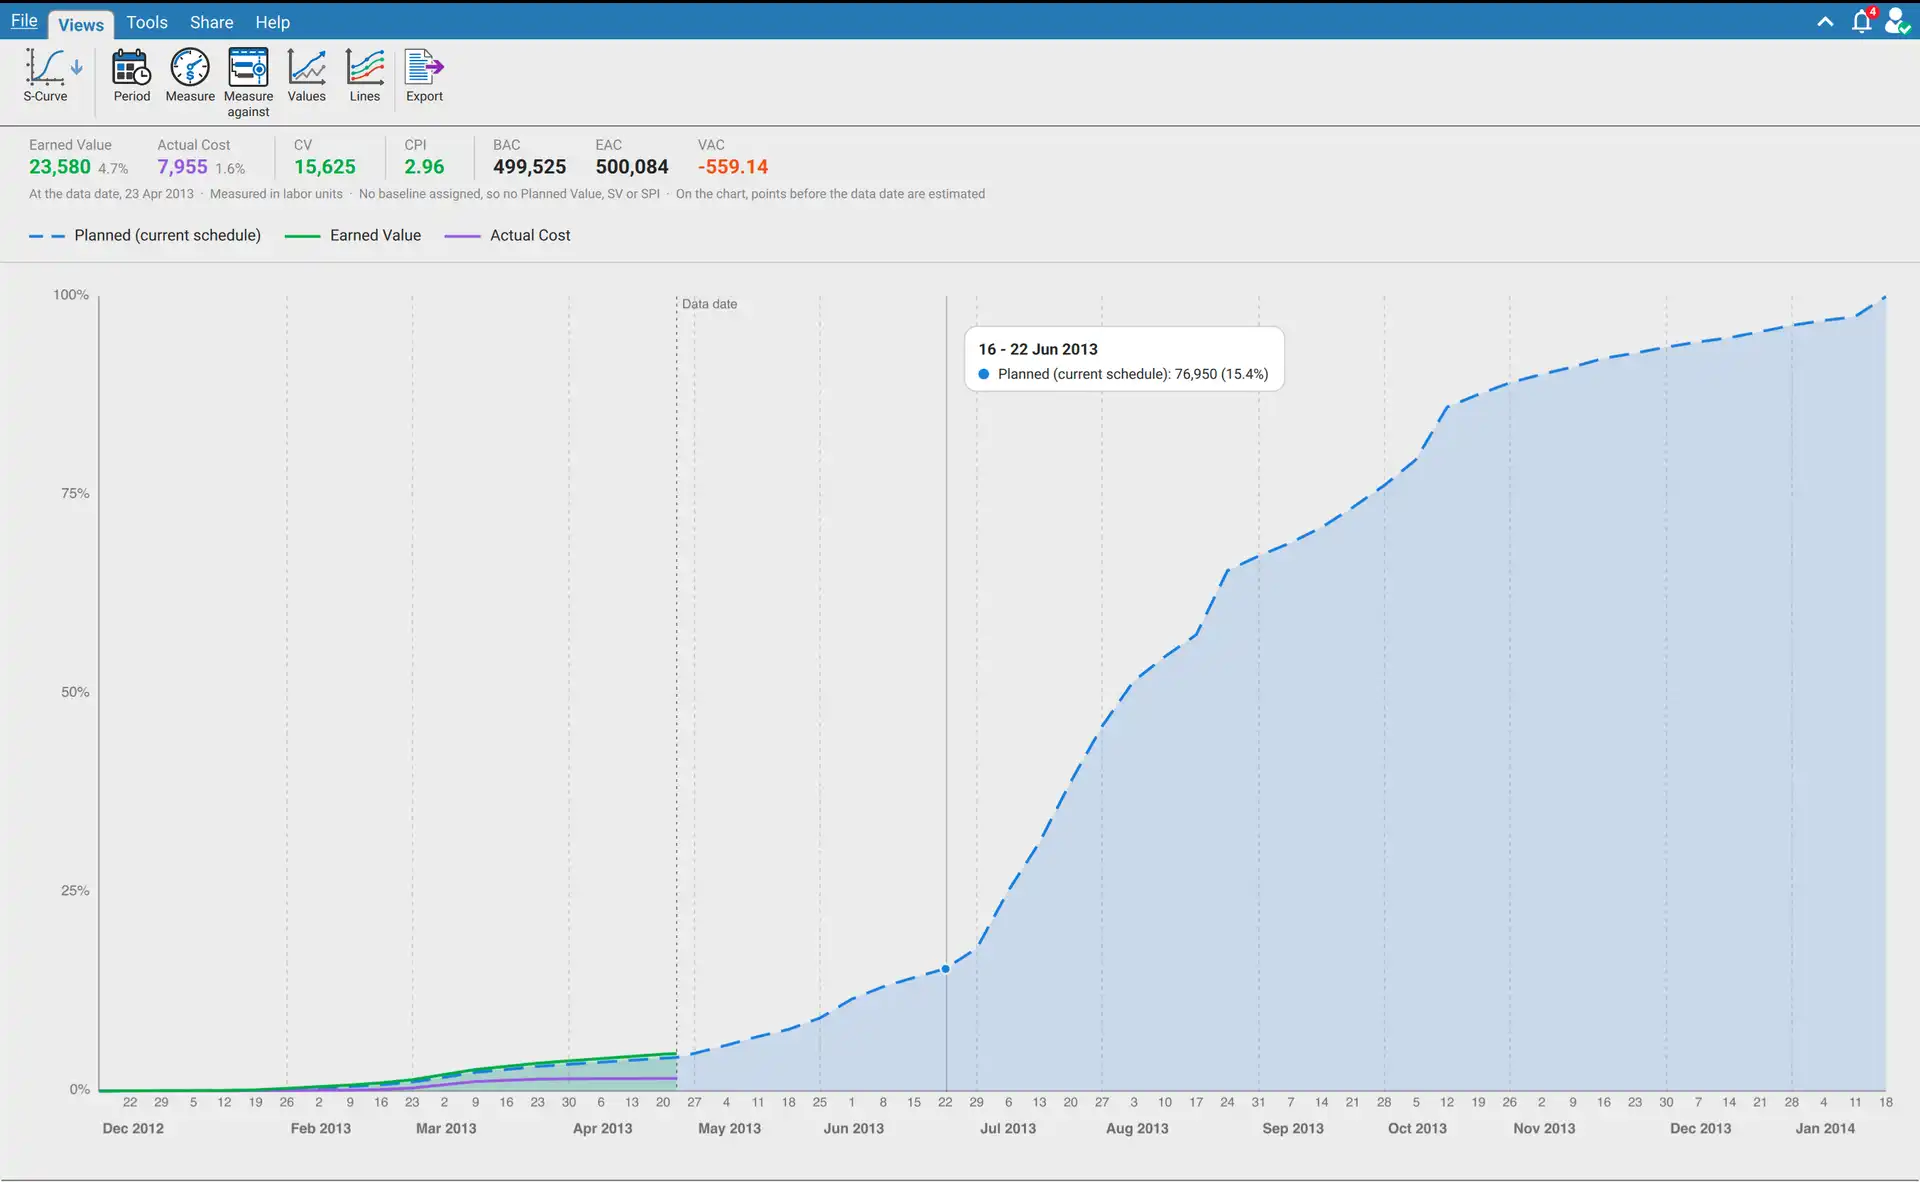
The figures at the data date
| Figure | Meaning |
|---|---|
| Planned Value | The part of the budget that should be done by the data date, going by the baseline |
| Earned Value | The budget of the work that is done: each activity's budget times its percent complete |
| Actual Cost | What has been spent so far, or the labor units used so far |
| SV | Schedule variance, Earned Value minus Planned Value |
| CV | Cost variance, Earned Value minus Actual Cost |
| SPI | Earned Value divided by Planned Value. Under 1 is behind the baseline |
| CPI | Earned Value divided by Actual Cost. Under 1 is costing more than budgeted |
| BAC | Budget at completion, the whole budget. Every percent in the view is a percent of it |
| EAC | Estimate at completion, Actual Cost plus what the schedule says is still to come |
| VAC | Variance at completion, BAC minus EAC |
Planned Value, Earned Value and Actual Cost also show their share of the budget. Rest the pointer on any figure for its full name, the sum with this schedule's own numbers, and what the value says about the job.
A figure that does not apply is left out, not shown as zero. Planned Value, SV and SPI need a baseline to measure against. Earned Value and the figures built on it need at least one started activity. Actual Cost, CV, CPI, EAC and VAC are not shown when measuring in duration, which has no actual cost.
The line under the figures names the data date, what is being counted and the baseline measured against.
The toolbar
| Button | Choices | What it changes |
|---|---|---|
| Period | Daily, Weekly (Mon - Sun), Weekly (Sun - Sat), Monthly, Quarterly, Yearly | How often a point is drawn. No figure changes |
| Measure | Cost, Labor Units, Duration | What everything is counted in. Until you pick, cost is used when the schedule carries cost, then labor units, then duration hours |
| Measure against | None (current schedule), the four baselines, and the baselines saved in a Microsoft Project file | What the schedule is measured against |
| Values | Cumulative (running total), Per period | Running totals, which give the S shape, or what each period adds on its own |
| Lines | The planned line, Earned Value, Actual Cost | Which lines are drawn |
| Export | Saves the figures and a picture of the chart as an Excel file |
The tick in Measure and Measure against sits on what is in use. A greyed entry is one this schedule cannot offer: a measure it does not carry, or a baseline slot marked (not assigned). Rest the pointer on an entry of Measure, Values or Lines to see what it does, or why it is greyed.
Measure and Measure against reach beyond this view. The Earned Value columns of the Activity table and the earned value section of the Schedule Analyzer report follow the same two choices. Each of those columns says in its definition what is in force.
What is measured against
| Schedule | Baselines offered |
|---|---|
| Primavera P6 | The baselines assigned to the schedule, up to four. See How to Assign and Manage Baselines |
| Microsoft Project | The baselines saved inside the file, listed as MS Project Baseline and MS Project Baseline 1 to 10. The first one is used as soon as the file is open |
With no baseline there is no Planned Value, SV or SPI. Pick None (current schedule), or open a schedule that has no baseline, and the dashed line becomes Planned (current schedule): the budget spread over the schedule's own dates as they stand now. It shows where the schedule is heading and is not a plan to be measured against.
Reading the chart
| Element | Meaning |
|---|---|
| Dashed blue line | The planned line: the budget spread evenly over each activity's baseline dates, up to the whole budget |
| Green line | Earned Value, up to the data date |
| Purple line | Actual Cost, up to the data date |
| Vertical dotted line | The data date |
| Labels under the chart | Each point, with the month or year it belongs to beneath |
Points before the data date are estimated. A schedule file records where each activity stands now, not where it stood in earlier months. The figures at the data date are exact. Before it, each activity's earned value and actual cost are spread evenly from its actual start to its actual finish, or to the data date while it is running.
Reading a period
Move the pointer across the chart. A vertical line follows the nearest point, a dot marks it on each line, and a card gives the period with the amount and percentage of each line. On the data date the card says Data date.
A Microsoft Project file with no status date
The data date is then taken from the latest progress the schedule records, and the line under the figures says it is estimated from the latest progress. A schedule in which nothing has started is read as of its planned start, and the line says so. One with no planned start either is read as of today.
When the chart is empty
| Message | Cause |
|---|---|
| No data, open a project to view the S-Curve | No schedule is open |
| There is nothing to draw yet | No activity has dates to draw a line from |
| No line is switched on | Every entry under Lines is off |
On a very long schedule Daily gives way to a wider period, and the line under the figures says which one is drawn.
Requirements
Requires an open schedule and XER Reader Pro or XER Reader Cloud.