
How to Adjust Gantt Timescales, Zoom Levels, and Timeline Units
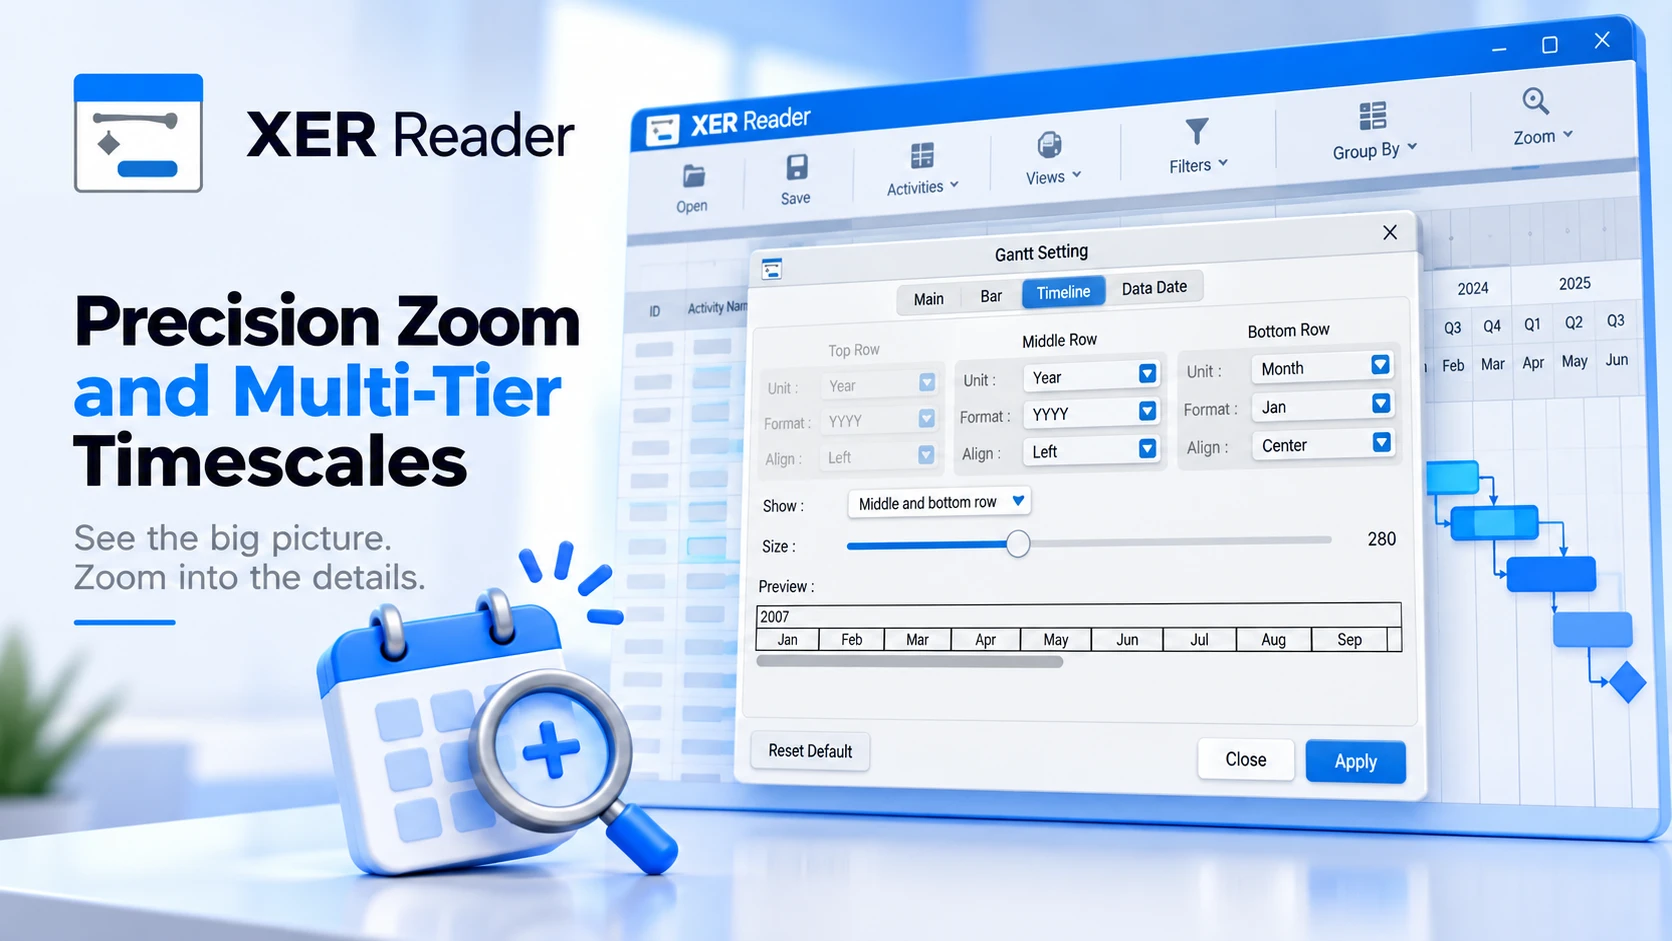
The Gantt chart timescale provides the temporal framework for interpreting project duration, logic relationships, and activity execution. In XER Reader, you can adapt the timeline to any scope, from multi-year executive overviews down to daily task coordination, using multi-tier interval settings and interactive drag-to-zoom controls.
Accessing the Timeline Configuration Tab
Timeline display options and timescale formatting are managed directly from the primary activity interface:
- Open a schedule file (such as a Primavera P6
.xeror Microsoft Project.mppfile) and navigate to the Activities view. - On the main toolbar, click the Gantt Setting button (represented by a gear icon over a Gantt bar).
- In the Gantt Setting dialog window, click the Timeline tab located in the top tab navigation.

Configuring Timescale Tiers and Row Visibility
XER Reader supports up to three stacked timeline tiers (Top Row, Middle Row, and Bottom Row). The Show dropdown determines how many tiers appear above the Gantt chart:
- All: Displays all three tiers simultaneously (Top, Middle, and Bottom). This is ideal for deep project hierarchies where you want to see annual, monthly, and weekly or daily divisions concurrently.
- Middle and bottom row: Displays two tiers. A balanced, industry-standard configuration suitable for regular progress monitoring (e.g., Year over Month, or Month over Week).
- Bottom row only: Displays a single compact tier. Maximizes vertical chart area on smaller displays while maintaining a baseline time scale.
Setting Timeline Units, Label Formats, and Alignment
Each timeline row can be customized independently to display the exact time interval and labeling syntax required for your schedule reporting:
- Unit: Defines the calendar increment for the row cells:
- Year: Displays calendar years for high-level macro planning.
- Quarter: Breaks the calendar into three-month quarters (Q1, Q2, Q3, Q4).
- Month: Divides the timeline into standard calendar months.
- Week: Displays weekly work periods.
- Day: Shows individual calendar days for detailed operational tracking.
- Hour: Granular hourly increments designed for short-duration plant turnaround and shutdown schedules.
- Format: Specifies how date labels are rendered within each cell. For example, months can be formatted as single letters (
J,F,M), abbreviations (Jan,Feb), full names (January), or month-year combinations (Jan 2026). Daily units offer variations such as day numbers (D), day and month (D-M), weekday names (Mon), or full date stamps. - Align: Controls whether the text label is positioned at the Left, Center, or Right edge of each interval cell.
Controlling Gantt Zoom Levels and Timeline Width
XER Reader offers two distinct ways to adjust timeline zoom and cell width:
Method 1: Interactive Drag-to-Zoom on the Timeline Header
You can dynamically expand or contract the timescale directly on the Gantt canvas without opening any dialogs:
- Move the mouse cursor over the bottom tier of the timeline header at the top of the Gantt chart. The cursor switches to a horizontal resize indicator (
↔). - Click and hold the mouse button, then drag horizontally:
- Drag to the Right: Expands cell widths, zooming in to reveal finer time intervals.
- Drag to the Left: Compresses cell widths, zooming out to fit longer schedule horizons onto the screen.
- Release the mouse button to lock the new scale in place. Activity bars and logic links smoothly adjust to the updated geometry.

Method 2: Precise Size Slider in Timeline Settings
For calibrated zoom values:
- Open Gantt Setting and switch to the Timeline tab.
- Locate the Size slider (adjustable from 20 to 1000, with a baseline default of 100).
- Slide to the desired numerical width or observe the live Preview canvas directly beneath the slider to evaluate the resulting cell spacing before closing the dialog.
Panning Across Project Dates
To navigate across extensive project durations without changing the zoom factor:
- Header Panning: Click and drag on the upper tiers of the timeline header (or hold down the mouse outside the bottom row resize zone). The cursor changes to a hand icon, allowing you to pan horizontally across dates smoothly.
- Horizontal Scrollbar: Drag the primary horizontal scrollbar located at the bottom of the Gantt chart to move quickly from project commencement to project completion.
Recommended Timescale Configurations by Schedule Scope
| Reporting Level | Show Setting | Tier Breakdown | Typical Size Range |
|---|---|---|---|
| Executive Multi-Year | Middle and bottom row | Middle: Year | Bottom: Quarter or Month | 30 to 60 |
| Monthly Progress Review | Middle and bottom row | Middle: Year | Bottom: Month | 80 to 120 |
| Weekly Lookahead Coordination | All | Top: Year | Middle: Month | Bottom: Week | 120 to 200 |
| Daily Field Execution | All | Top: Month | Middle: Week | Bottom: Day | 250 to 500 |
Resetting Timeline Defaults
If custom zoom or tier combinations make navigation unwieldy, click the Reset Default button in the bottom-left corner of the Gantt Setting dialog. This immediately restores factory timeline parameters (Size 100, standard Month/Week/Day intervals) without impacting your custom bar styles or color schemes.