
How to Navigate the Primary Interface: Toolbars, Panels, and Schedule Views
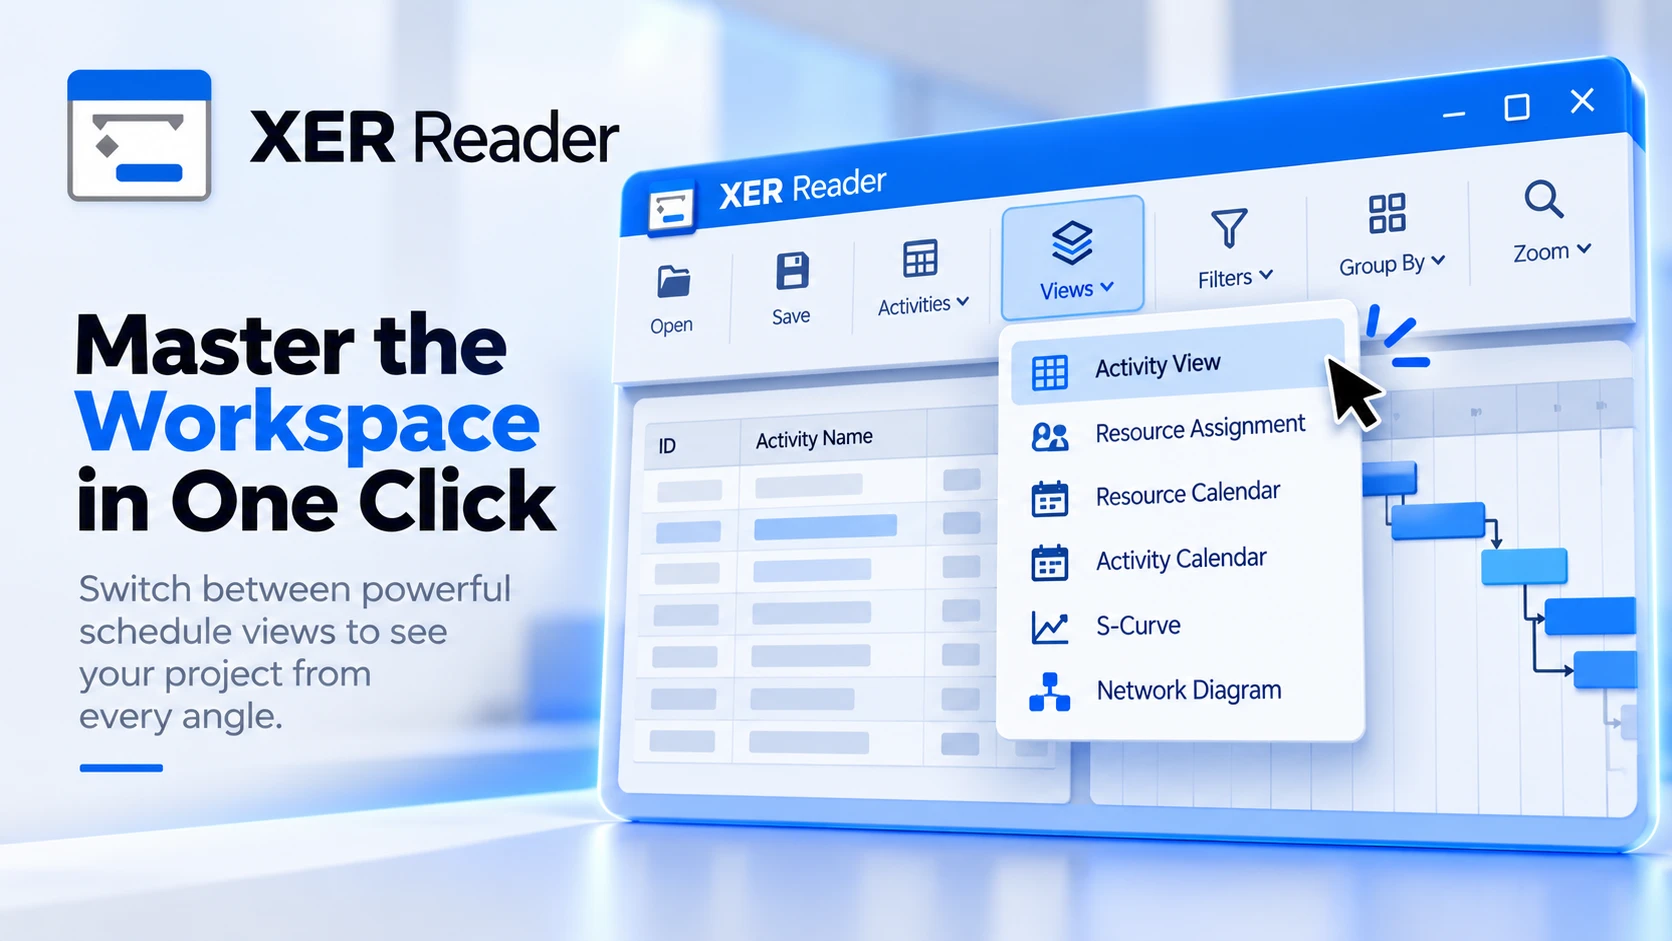
XER Reader provides a ribbon-based interface for schedule inspection, featuring six core analytical views, contextual toolbars, and collapsible detail docks.
Interface Overview
The workspace consists of three primary regions:
- Top Ribbon Toolbar: Houses persistent application menus (File, Tools, Share, Help) and the primary Views selector.
- Main Schedule Canvas: Displays the active schedule view (by default, the dual-pane Activity Table and Gantt Chart).
- Collapsible Panels & Docks: Side and bottom docks, including the left WBS Filter and bottom Activity Details inspector.

The 6 Core Schedule Views
Click the Views dropdown button on the ribbon to switch between views:
| View | Description | Key Use Case |
|---|---|---|
| 1. Activity View (Default) | Dual-pane display combining the hierarchical Activity spreadsheet on the left with the interactive Gantt chart on the right. | Standard schedule inspection, critical path analysis, and timeline tracking. |
| 2. Resource Assignment | Time-phased spreadsheet mapping labor, equipment, and material resources across time intervals (days, weeks, months). | Analyzing resource demand, planned units, actual consumption, and peak loading. |
| 3. Resource Calendar | Calendar grid showing resource working days, non-working days, shift schedules, and holiday exceptions. | Verifying resource availability and investigating shift-based scheduling constraints. |
| 4. Activity Calendar | Monthly and weekly calendar view plotting project activities directly into day cells, color-coded by WBS branch. | Field execution look-aheads and communicating scheduled work to site teams. |
| 5. S-Curve | Cumulative progress curves plotting planned vs. actual schedule progress and earned value over time. | Executive performance reporting and identifying project slippage trends. |
| 6. Network Diagram | Interactive PERT / PDM activity box network graph visualizing dependencies, driving logic lines, and network loops. | Inspecting sequence relationships and pinpointing schedule logic breaks. |
Contextual Tools Reference by View
When you switch views, the ribbon dynamically updates with tools tailored to that view:
Activity View Tools
| Tool | Function |
|---|---|
| WBS Filter | Toggles the left-side WBS hierarchy tree panel to isolate specific branches. |
| Filter | Applies preset filters (Critical, Completed, Active, Milestones) or opens custom filter manager. |
| Layout | Opens the Layout dialog to save, load, and manage custom column and filter arrangements. |
| Column | Selects visible activity attributes, customizes column order, and adjusts column widths. |
| Grouping | Groups activities hierarchically by WBS, Phase, Responsibility, or activity codes. |
| Tree | Expands or collapses all outline levels, or collapses directly to Levels 1 through 10. |
| Details | Toggles the bottom Activity Details inspector dock. |
| Copy / Find | Copies selected rows or cells to clipboard; searches activities by ID or name. |
| Gantt Setting | Adjusts Gantt timescale zoom, bar formatting, relationship logic lines, and gridlines. |
| Export to Pdf | Opens the multi-page vector PDF print preview and export generator. |
Other View Toolbars
- Resource Assignment Tools: Column, Grouping, Tree, Copy, Find, and Timeline Settings (configures time-bucket intervals).
- Resource & Activity Calendar Tools: Day, Week, and Month view toggles, plus Find to jump to a specific calendar date.
- S-Curve Tools: Month and Quarter period aggregation toggles.
- Network Diagram Tools: WBS Filter, Zoom In, Zoom 100%, and Zoom Out.
Activity Details Dock Tabs
When enabled via the Details button on the ribbon toolbar, the bottom dock displays granular activity data:

| Tab | Information Displayed |
|---|---|
| General | Activity ID, Name, Activity Type, Start/Finish dates, Duration, Percent Complete, and Primary Constraint. |
| Relationship | Predecessors and Successors tables with relationship types (FS, SS, FF, SF), lag values, and driving logic flags. |
| Resources | Assigned labor, non-labor, and material resources, including budgeted units, actual units, and costs. |
| Codes | Assigned project and global activity codes, category values, and descriptions. |
Global Ribbon Tabs
| Tab | Functions Available |
|---|---|
| File | Open schedule files via File → Open, access recent files list, close active project, and exit. |
| Tools | Querying for direct SQL database queries, Settings, Column Setting, Manage Baseline, and Schedule Analyzer (DCMA 14-point audit). |
| Share | Export to Excel/CSV, cloud schedule Share, and BI Connect for Power BI and Tableau integration. |
| Help | About, external link to official Website, Training video library, and interactive Walkthrough. |