Insights and guides to help you master project schedule analysis.
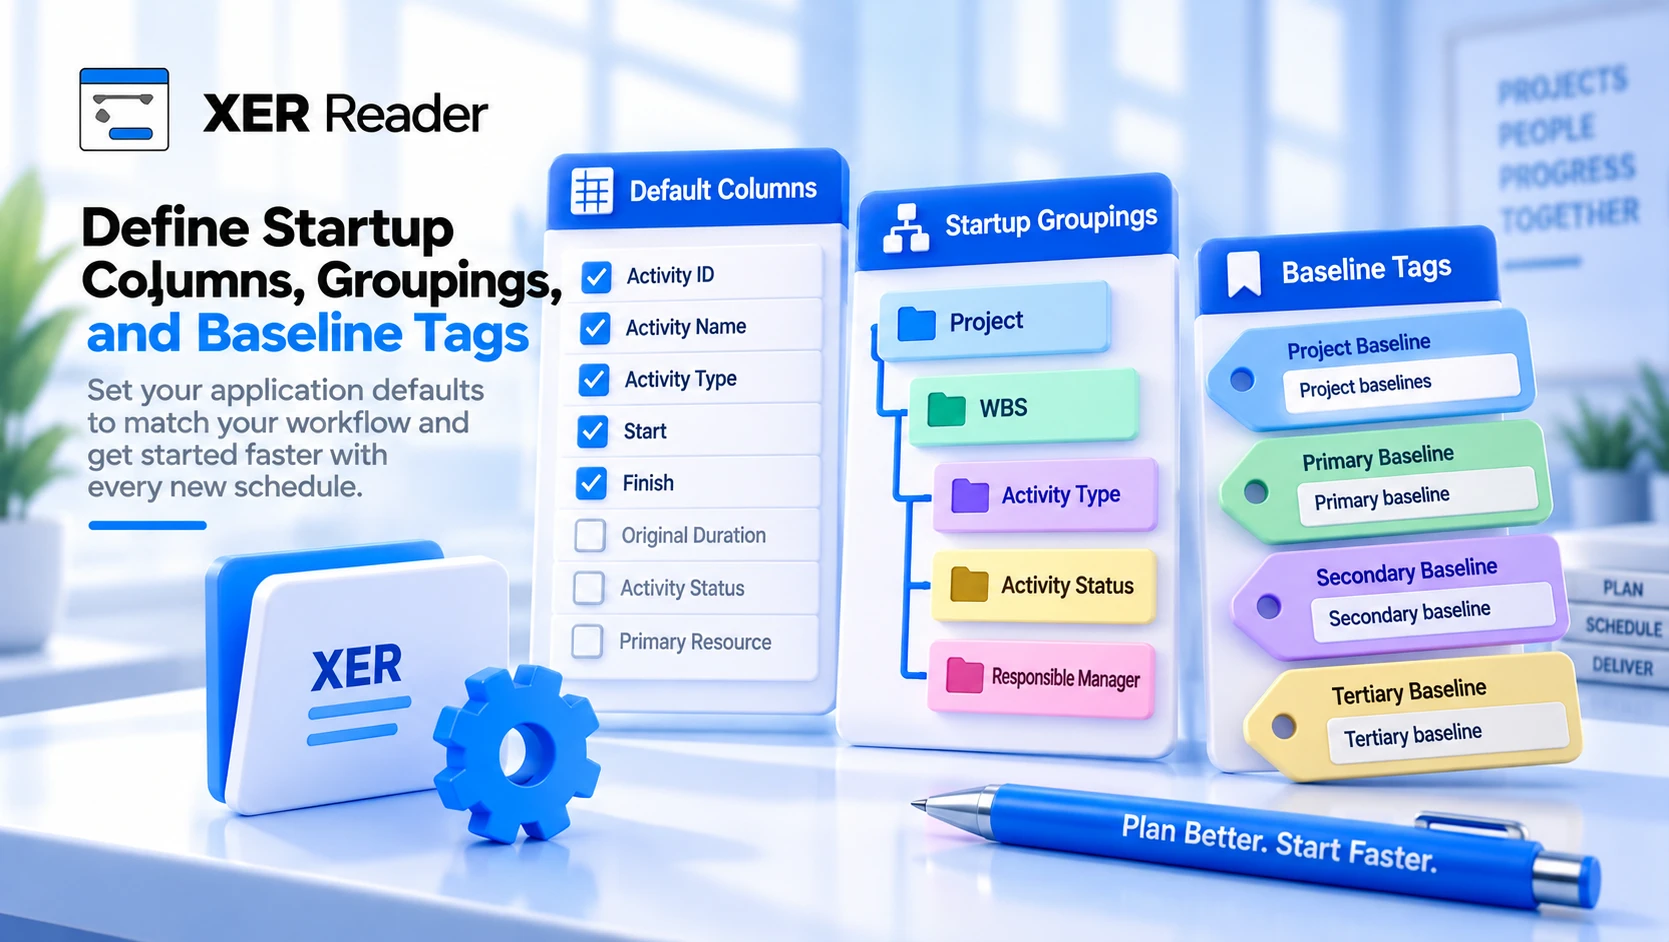
Decide which columns and which grouping every new file opens with, per file format, and rename the four baseline tags.
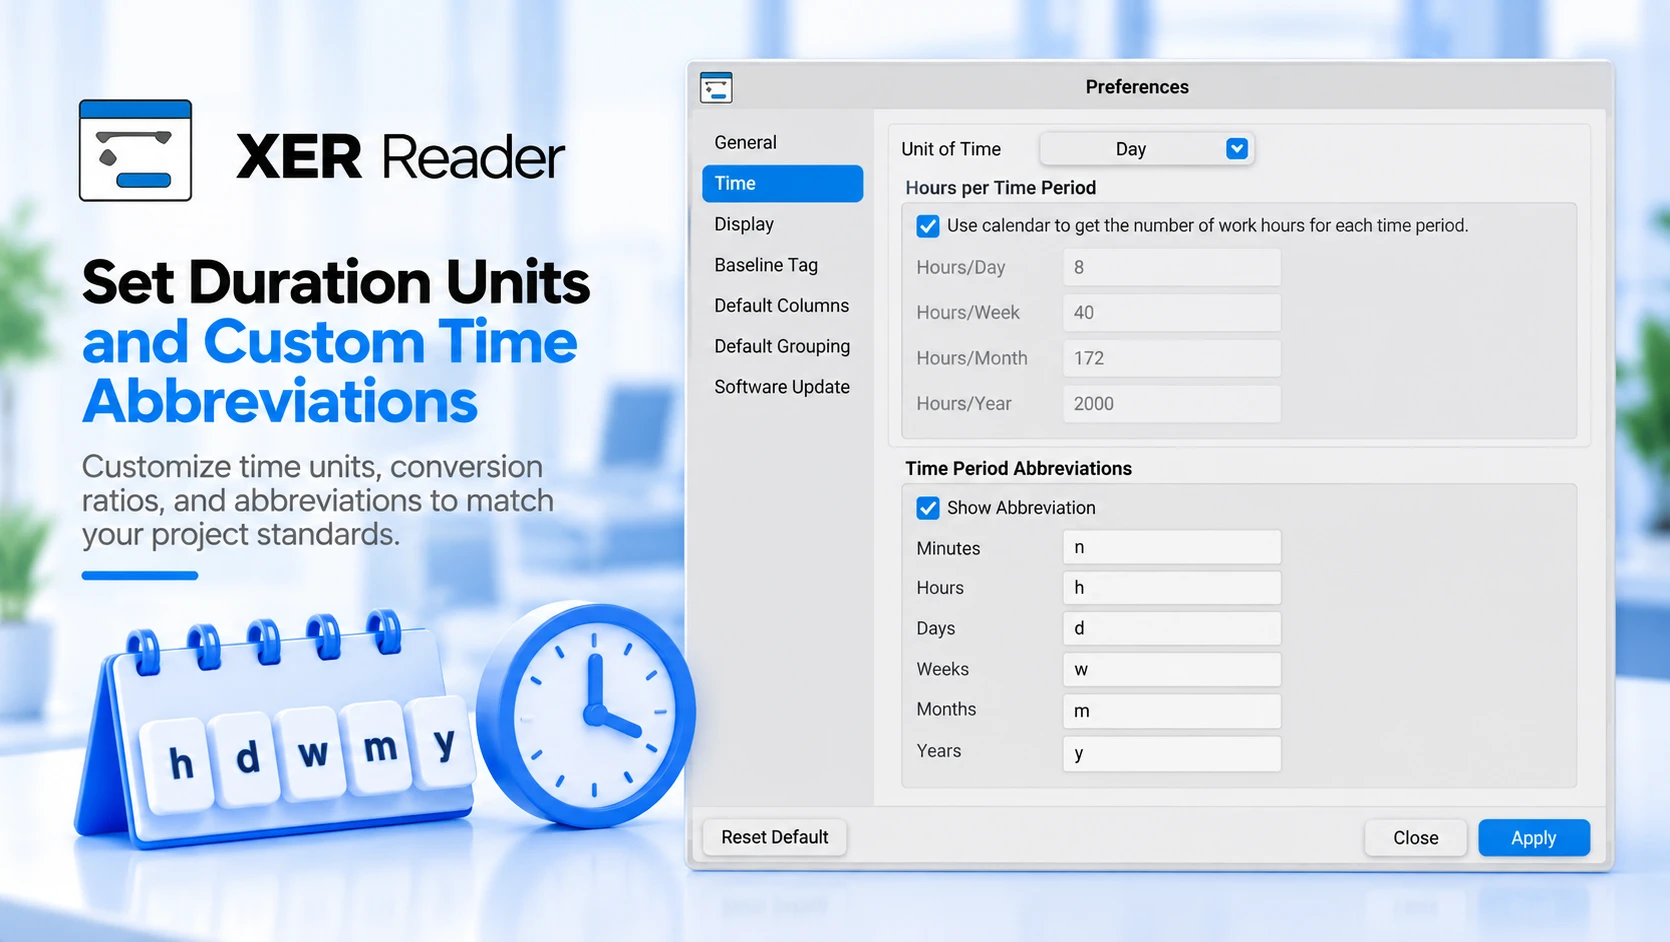
Choose the unit durations and units are reported in, decide whether the calendar or a fixed conversion supplies the hours, and set the abbreviations.
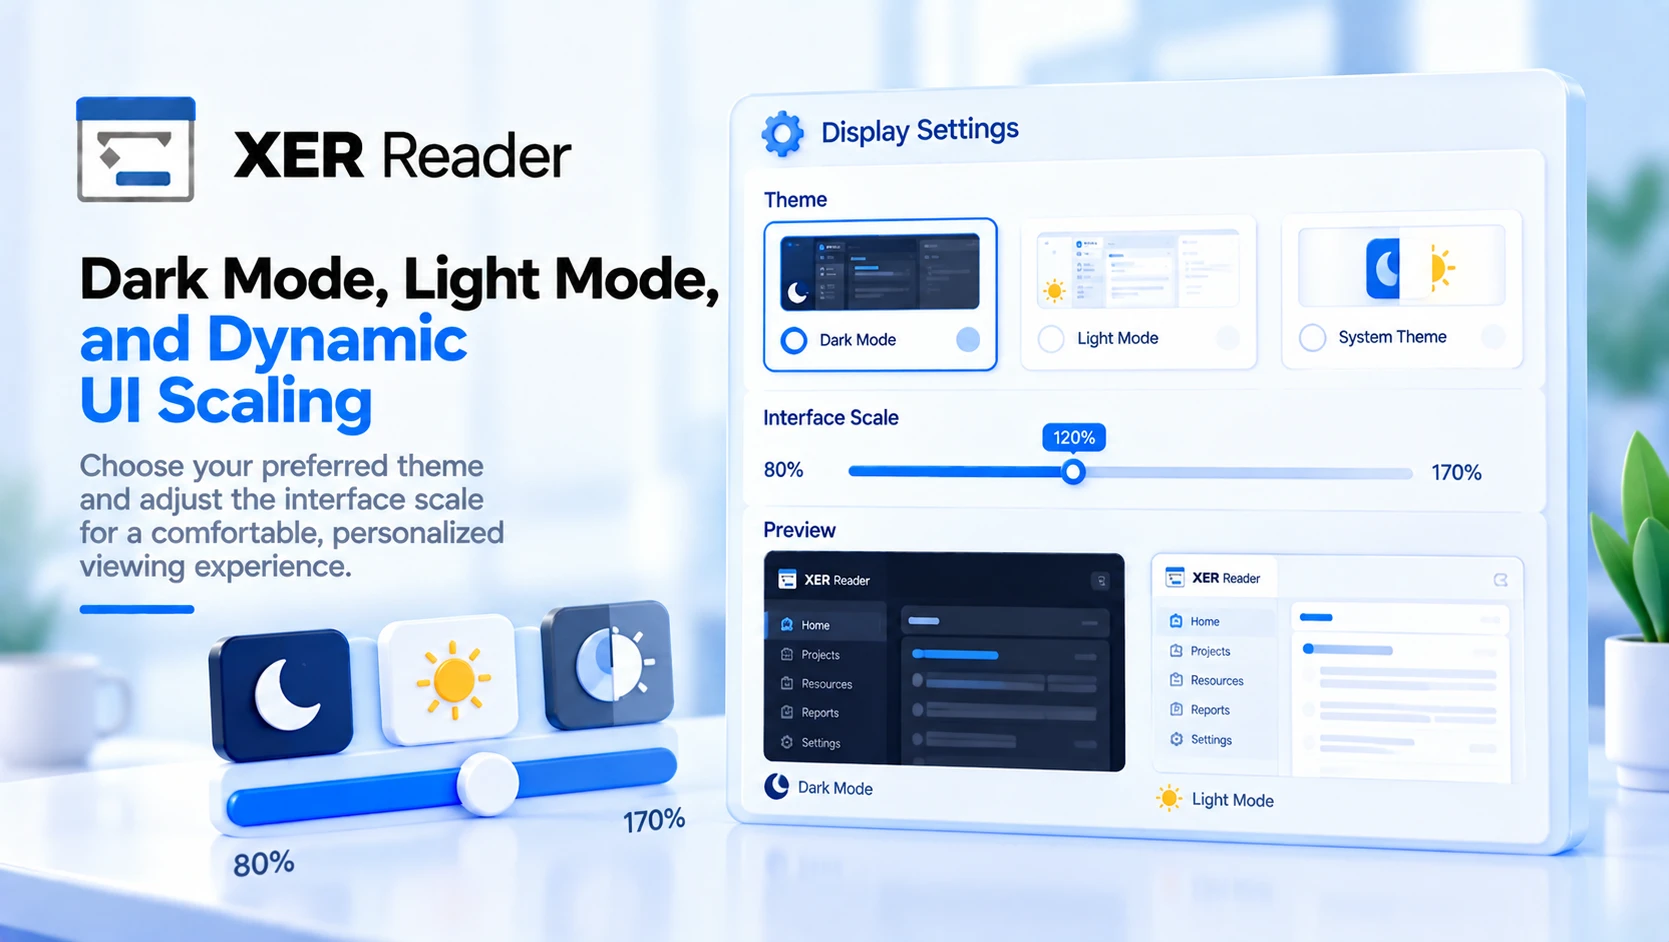
Set the application to follow the system theme or force light or dark, and scale the whole interface between 80 and 170 percent.
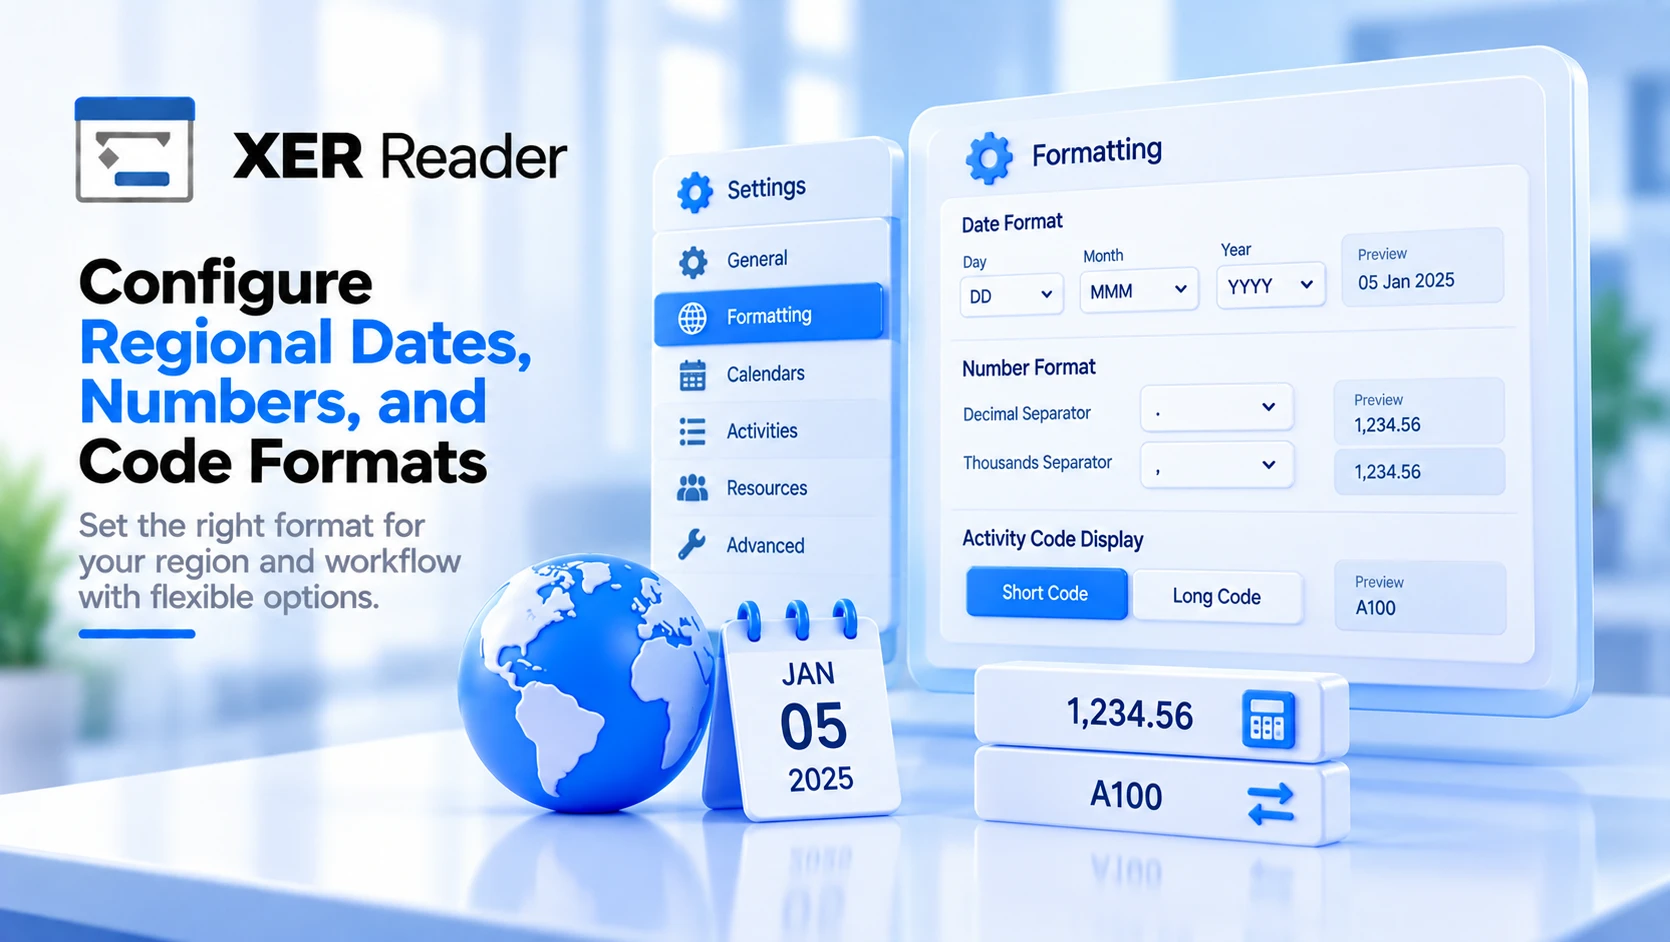
Compose the date format from its parts, choose the decimal symbol, and decide whether activity codes read as short or long values.
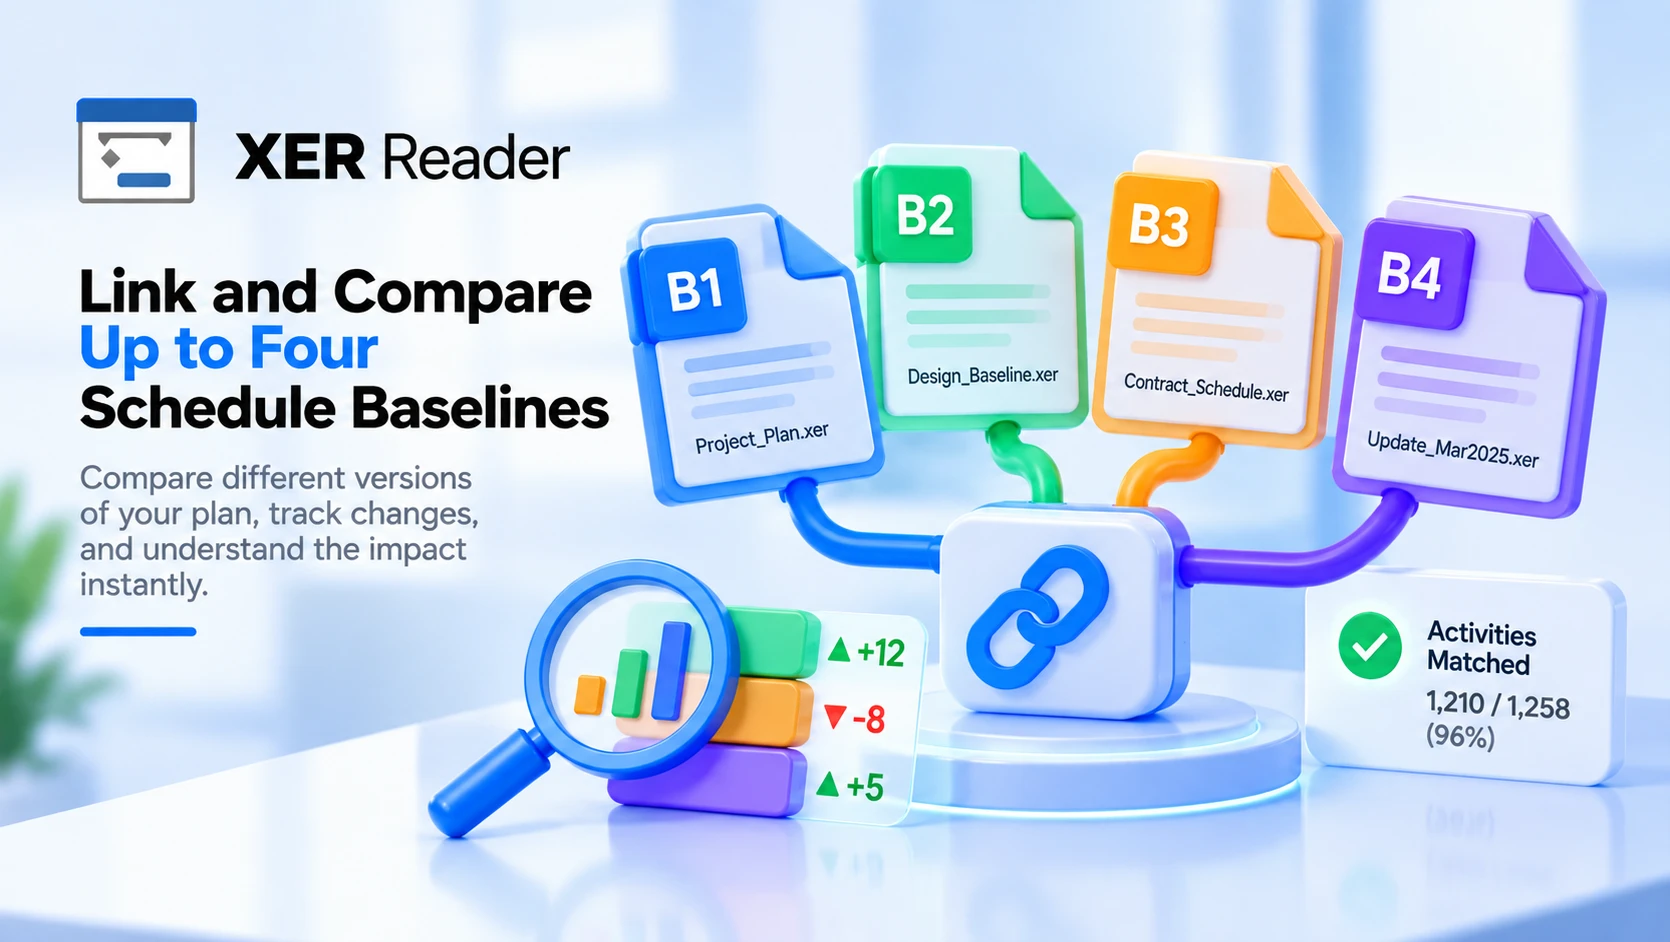
Assign one project as another's baseline, understand which of the four slots the Schedule Analyzer actually reads, and how baseline activities are matched.
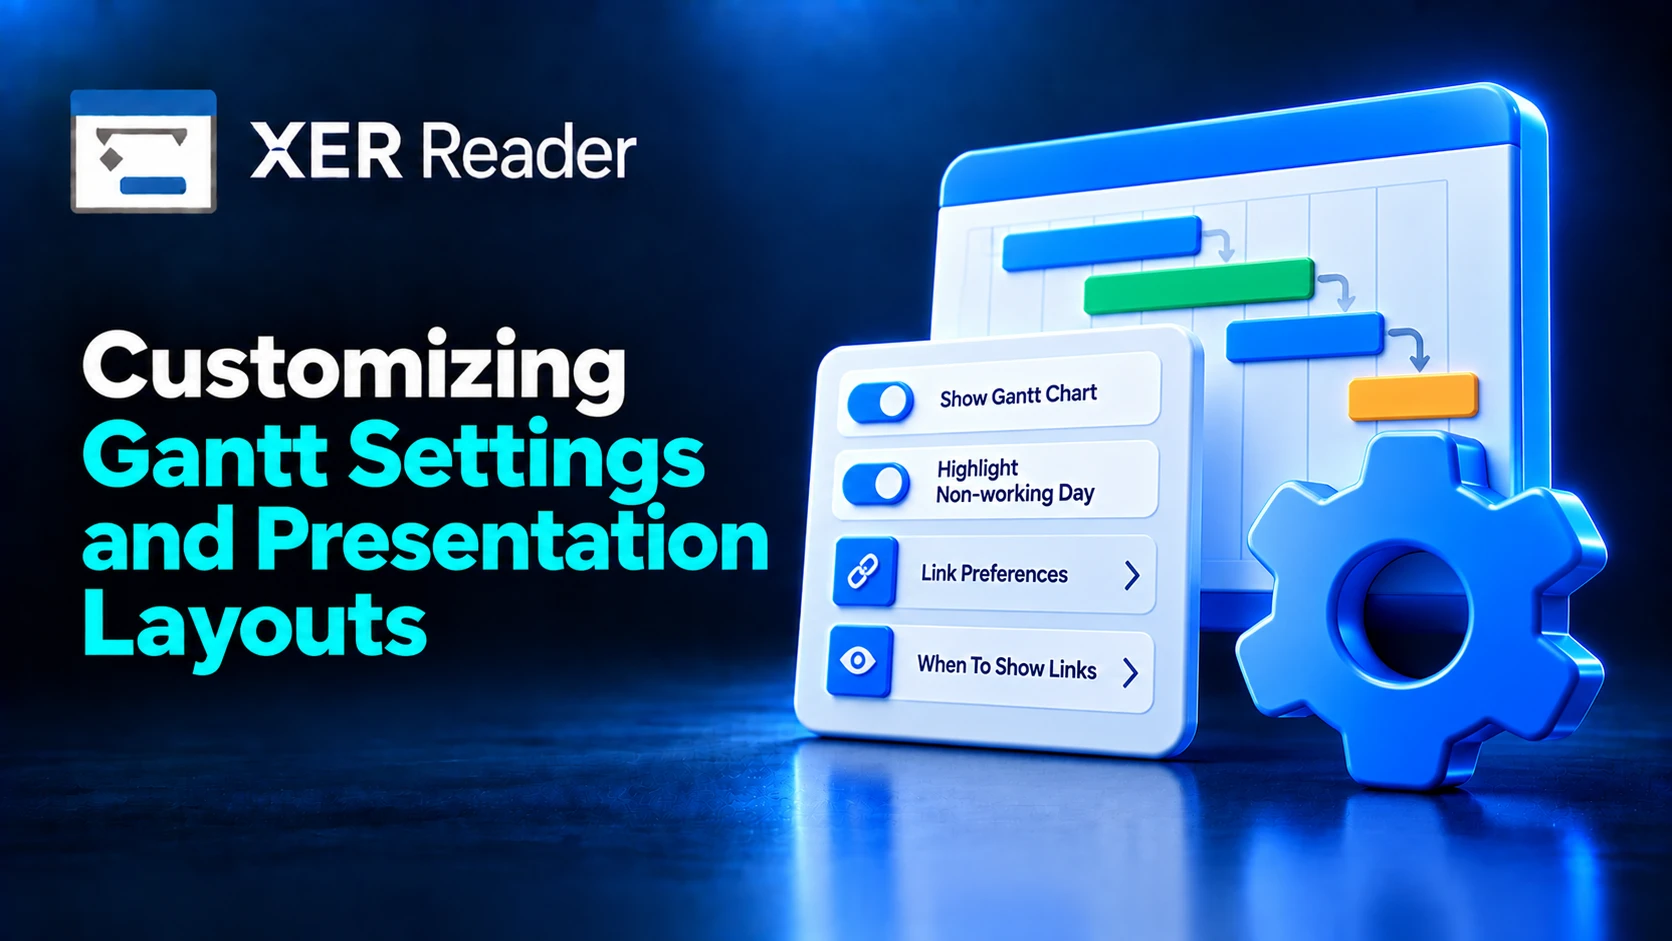
A complete guide to configuring Gantt display options, non-working day highlighting, relationship line visibility rules, link colors, and interactive hover tracing in XER Reader.
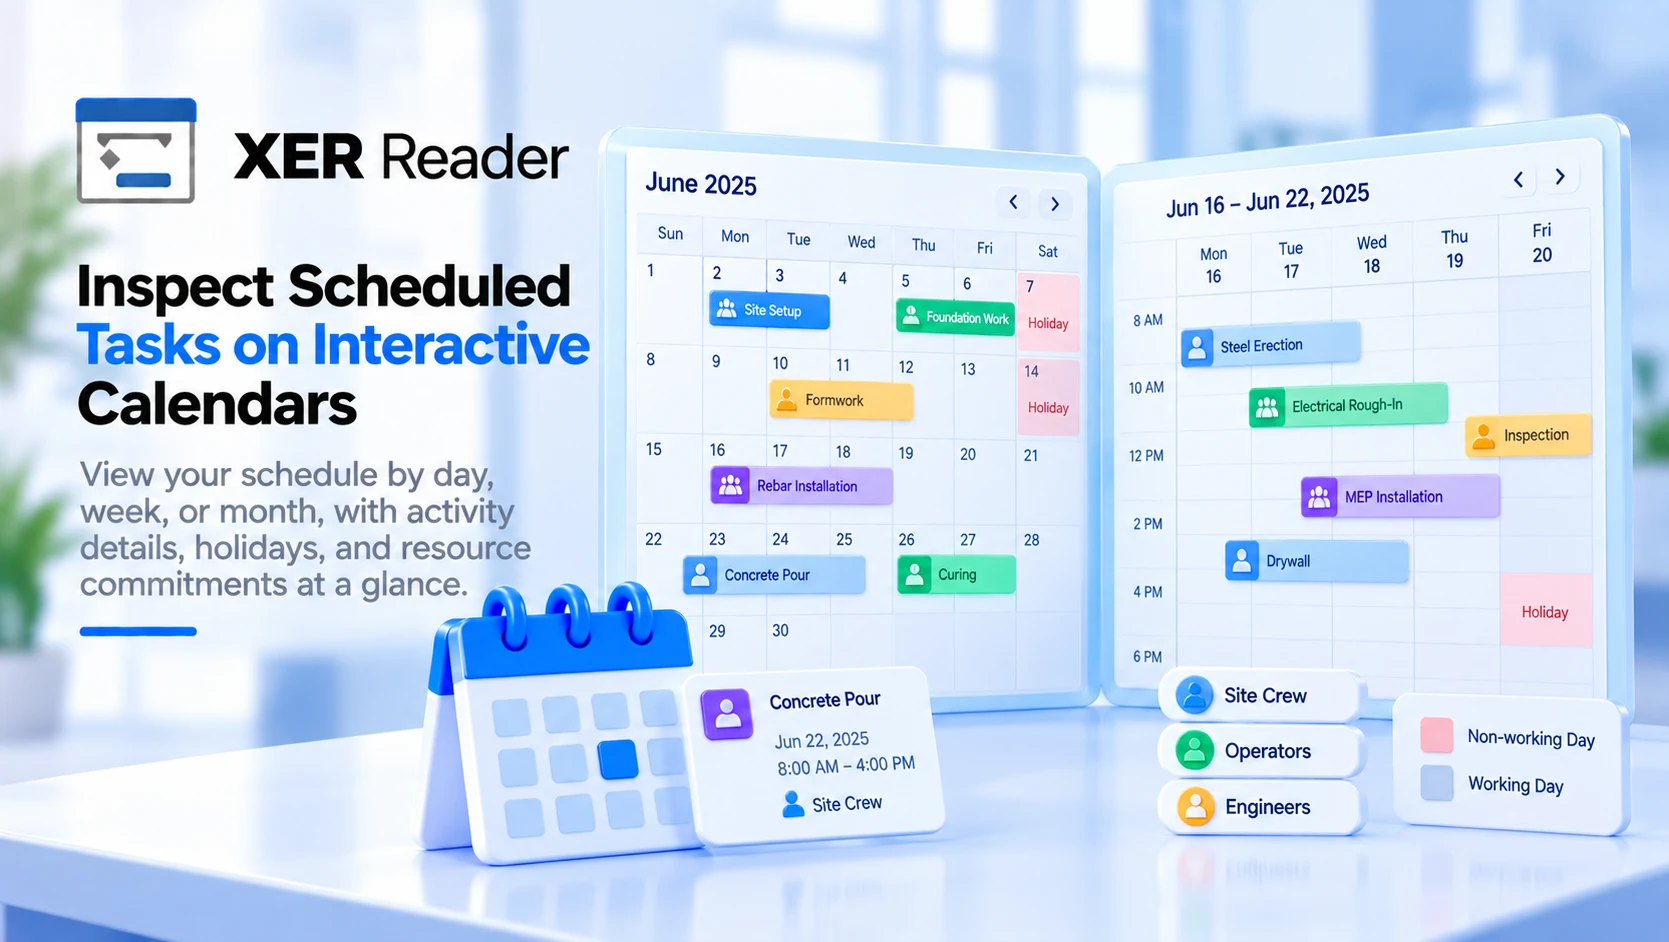
Put the schedule on a calendar in day, week or month form, and use the unlabelled per resource day layout that answers who is committed when.
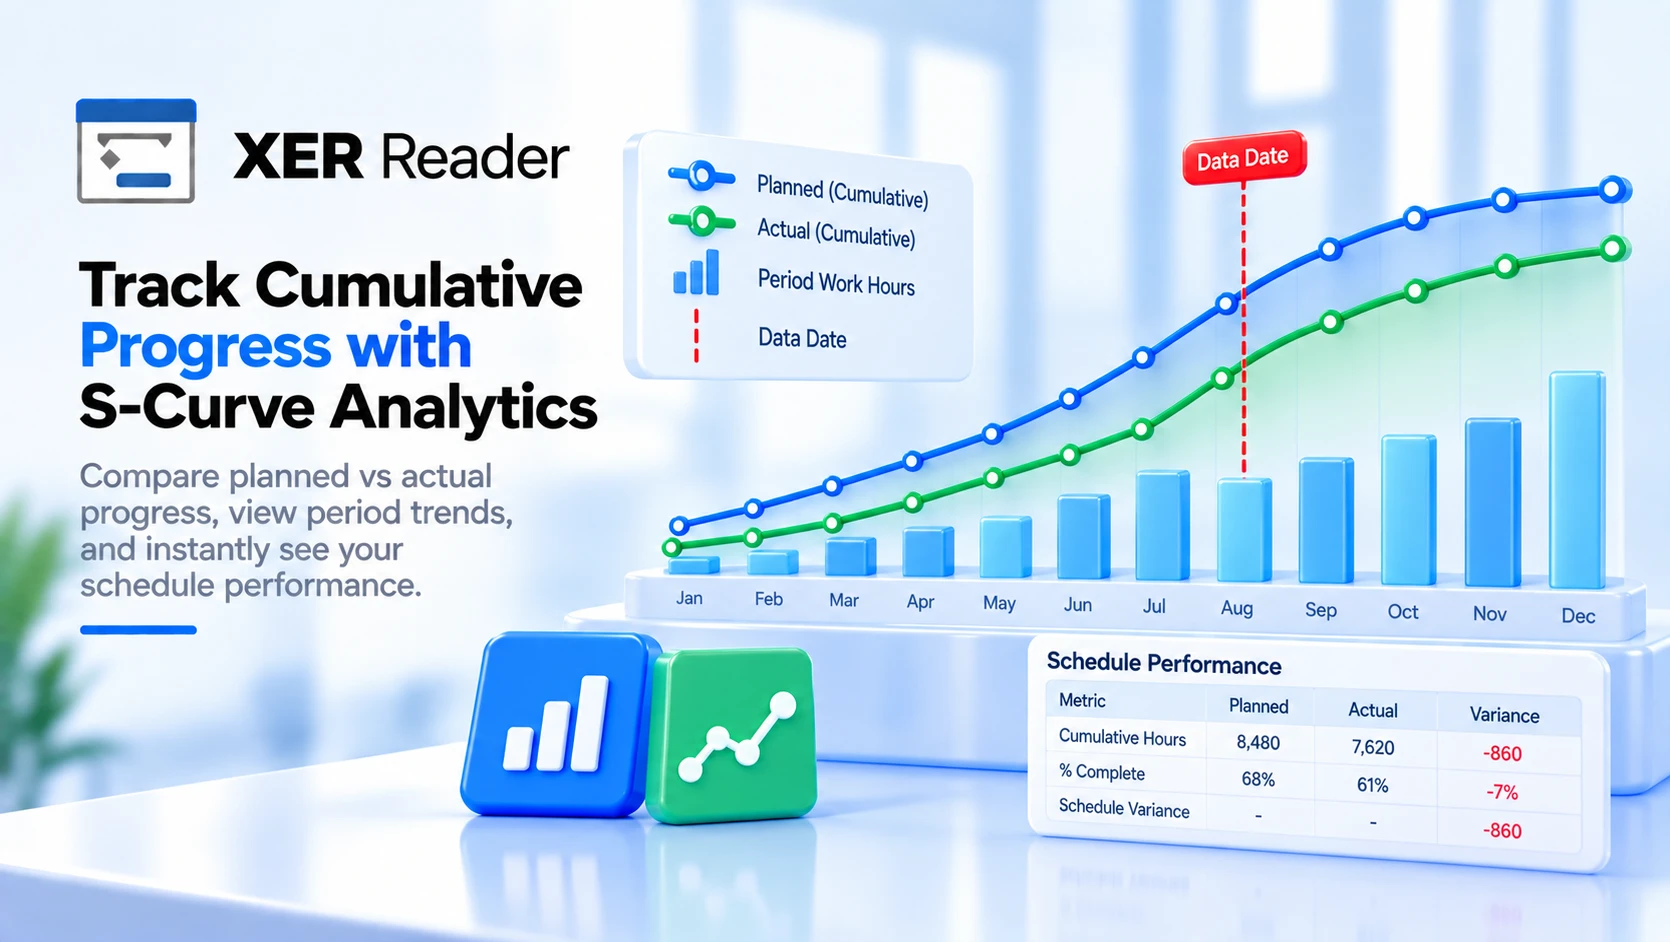
Cumulative planned against actual progress, weighted by planned hours. What the Planned, Actual and SV figures are measured at, and what the curves leave out.
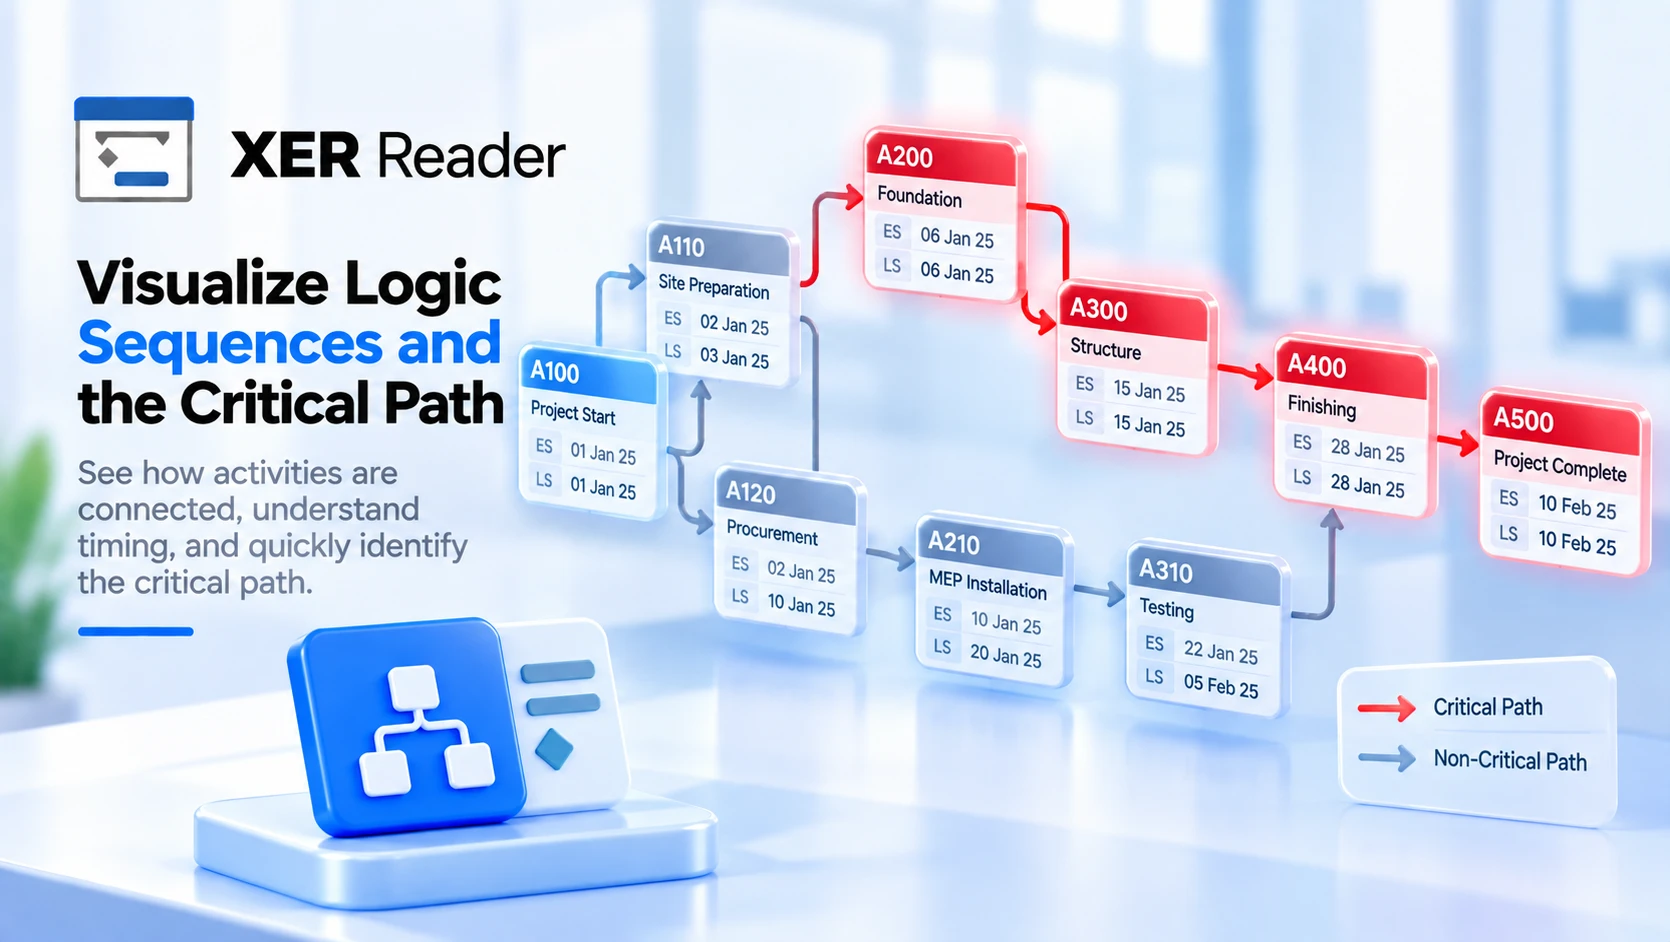
See the schedule as a logic network: early and late dates on every box, the critical path as a red run, and one click to trace what drives an activity.
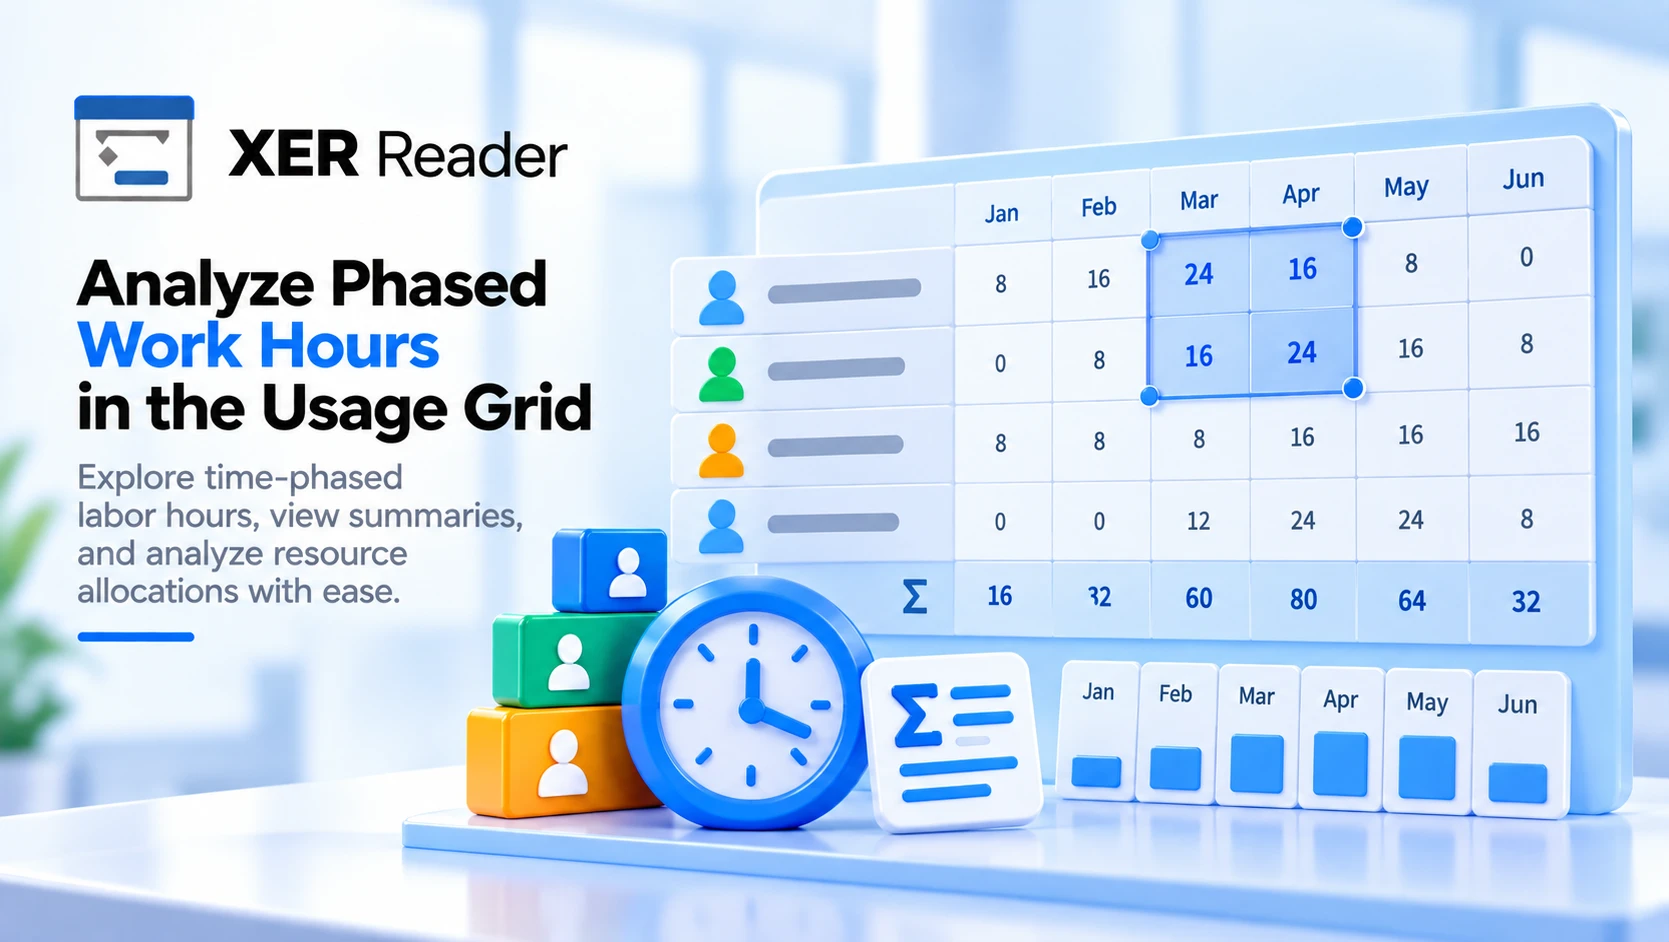
The units grid beside the activity table: what each cell means, how to select a block across periods, and how to get the numbers into a spreadsheet.

See activities grouped by the resource assigned to them, with budgeted and remaining units spread across a time scale you control.
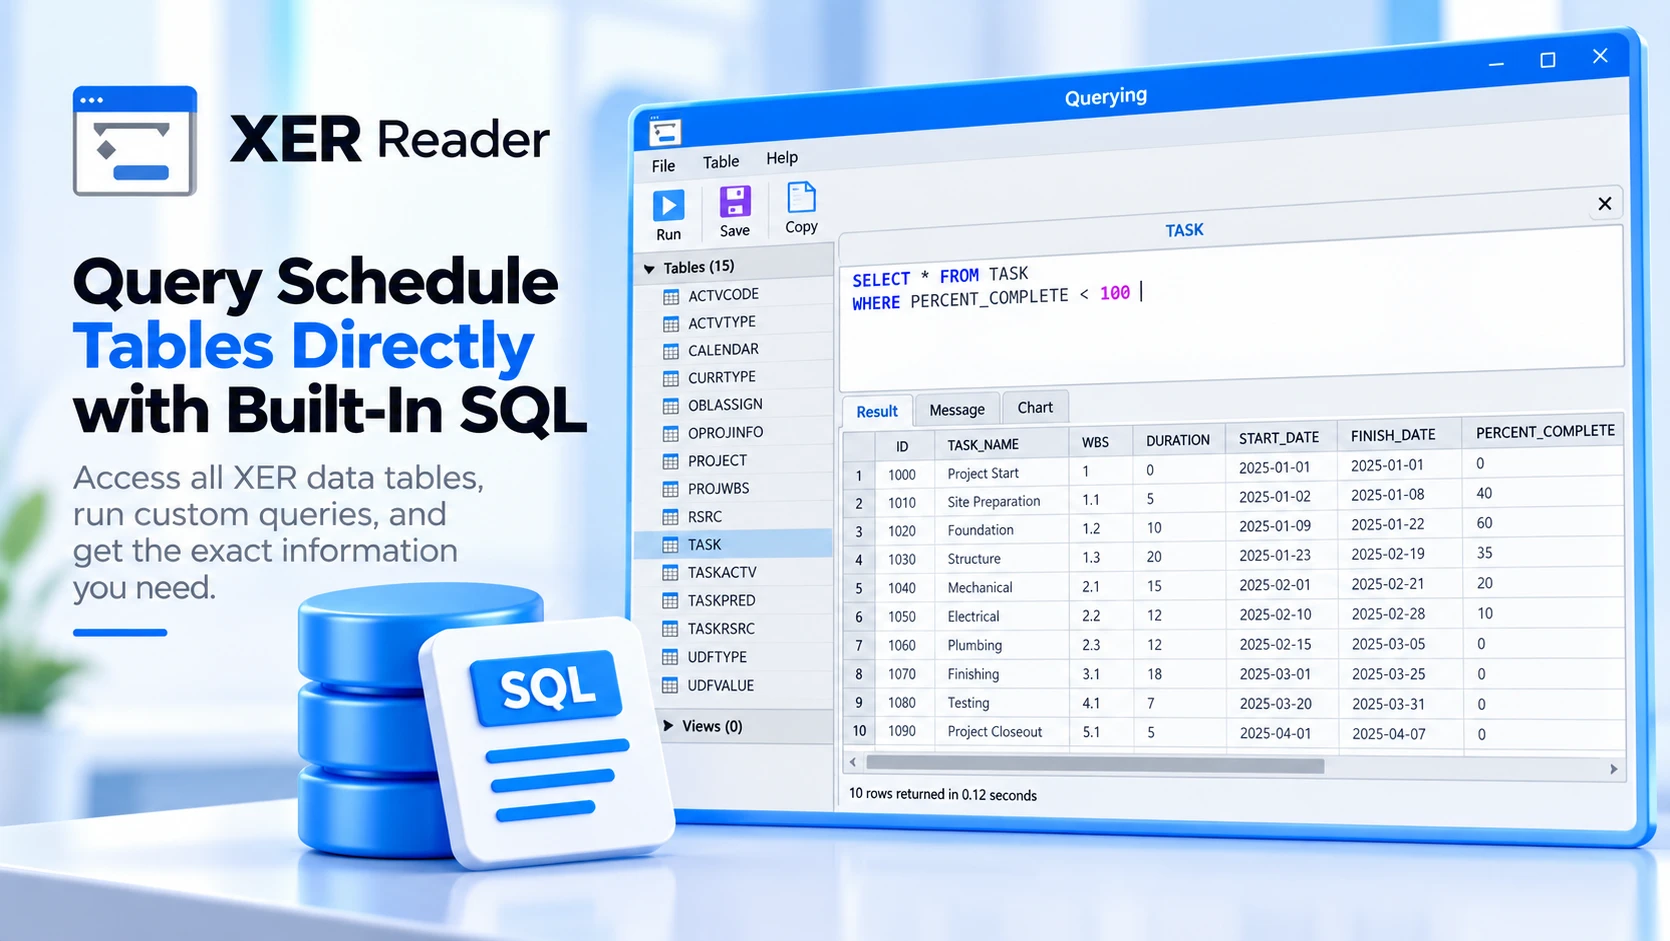
Run SQL against the converted P6 tables, join and group the data, chart the result, and understand which tables refuse to be written.

Run 19 schedule quality checks against an open project, read the score and the cards behind it, tune the thresholds, and export the report that names the failing activities.

Handle a multi project XER file with the Project Options dialog, including loading only the activities that link to another project.

Expose a project database as a REST API, query it with SQL from Power BI or Google Sheets, and manage the token that authenticates every connection.

On the Share tab, Share publishes a schedule as a link that opens in a browser with nothing installed. The Share tab holds Export, Share and...
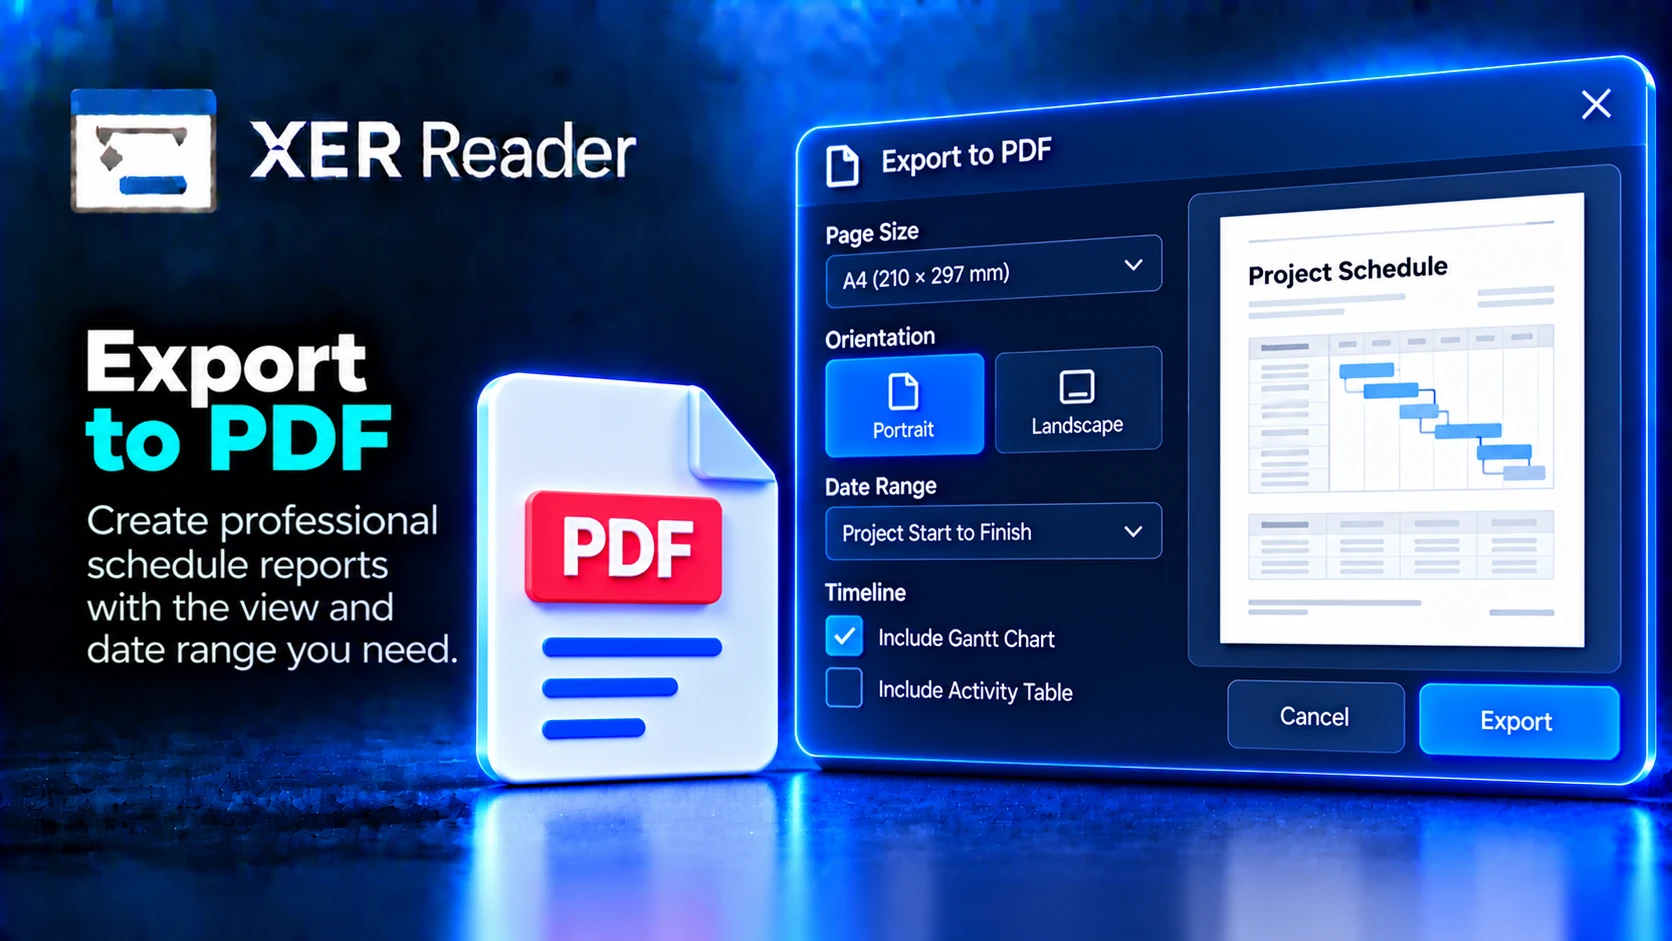
Export to Pdf on the Views tab opens a print preview rather than writing a file immediately. The preview renders the first pages and updates...
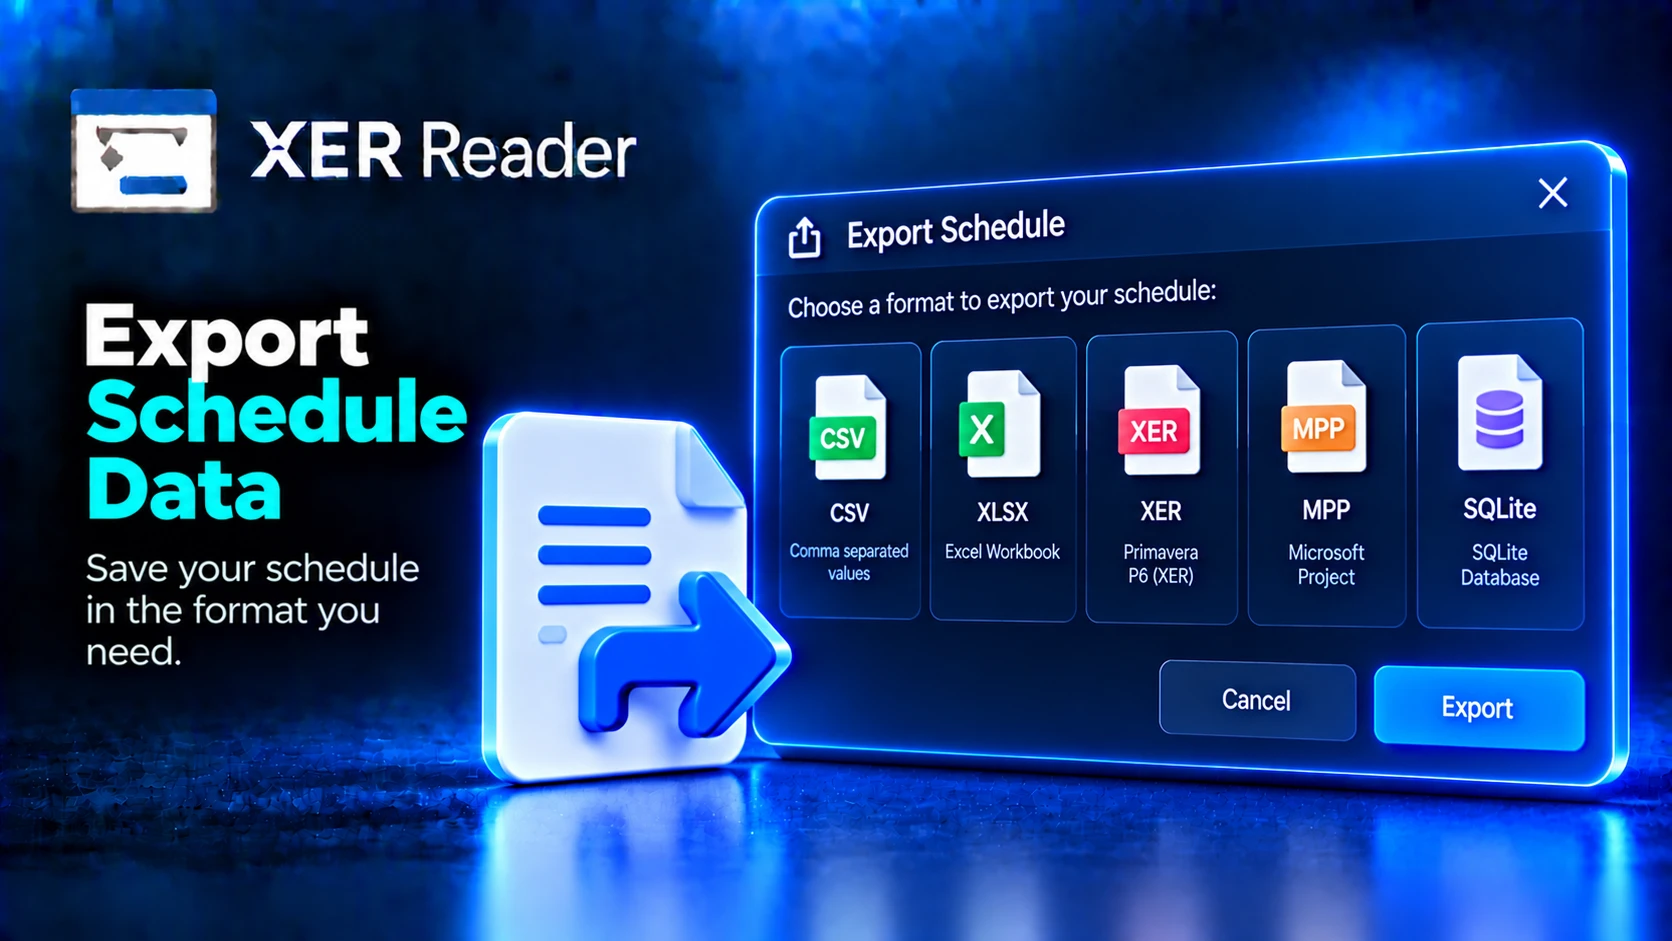
On the Share tab, Export writes schedule data to a file. The available output formats depend on whether you export the project or the activi...
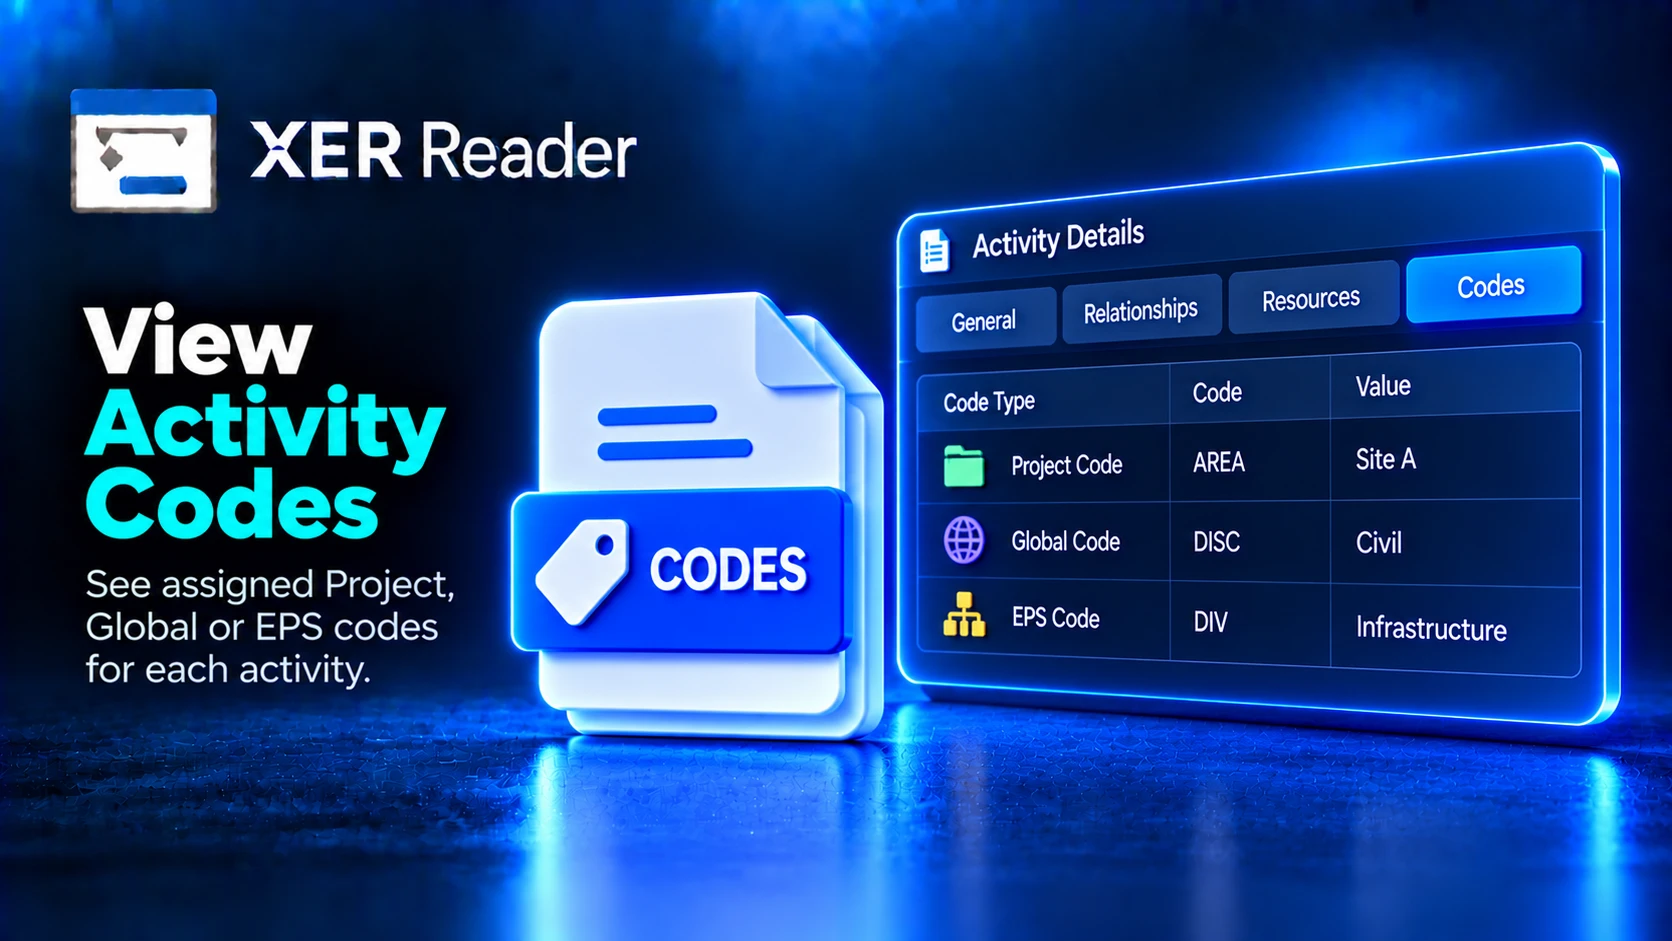
The Codes tab lists the activity code values assigned to the selected activity. The Codes tab shows the activity code values carried by the...
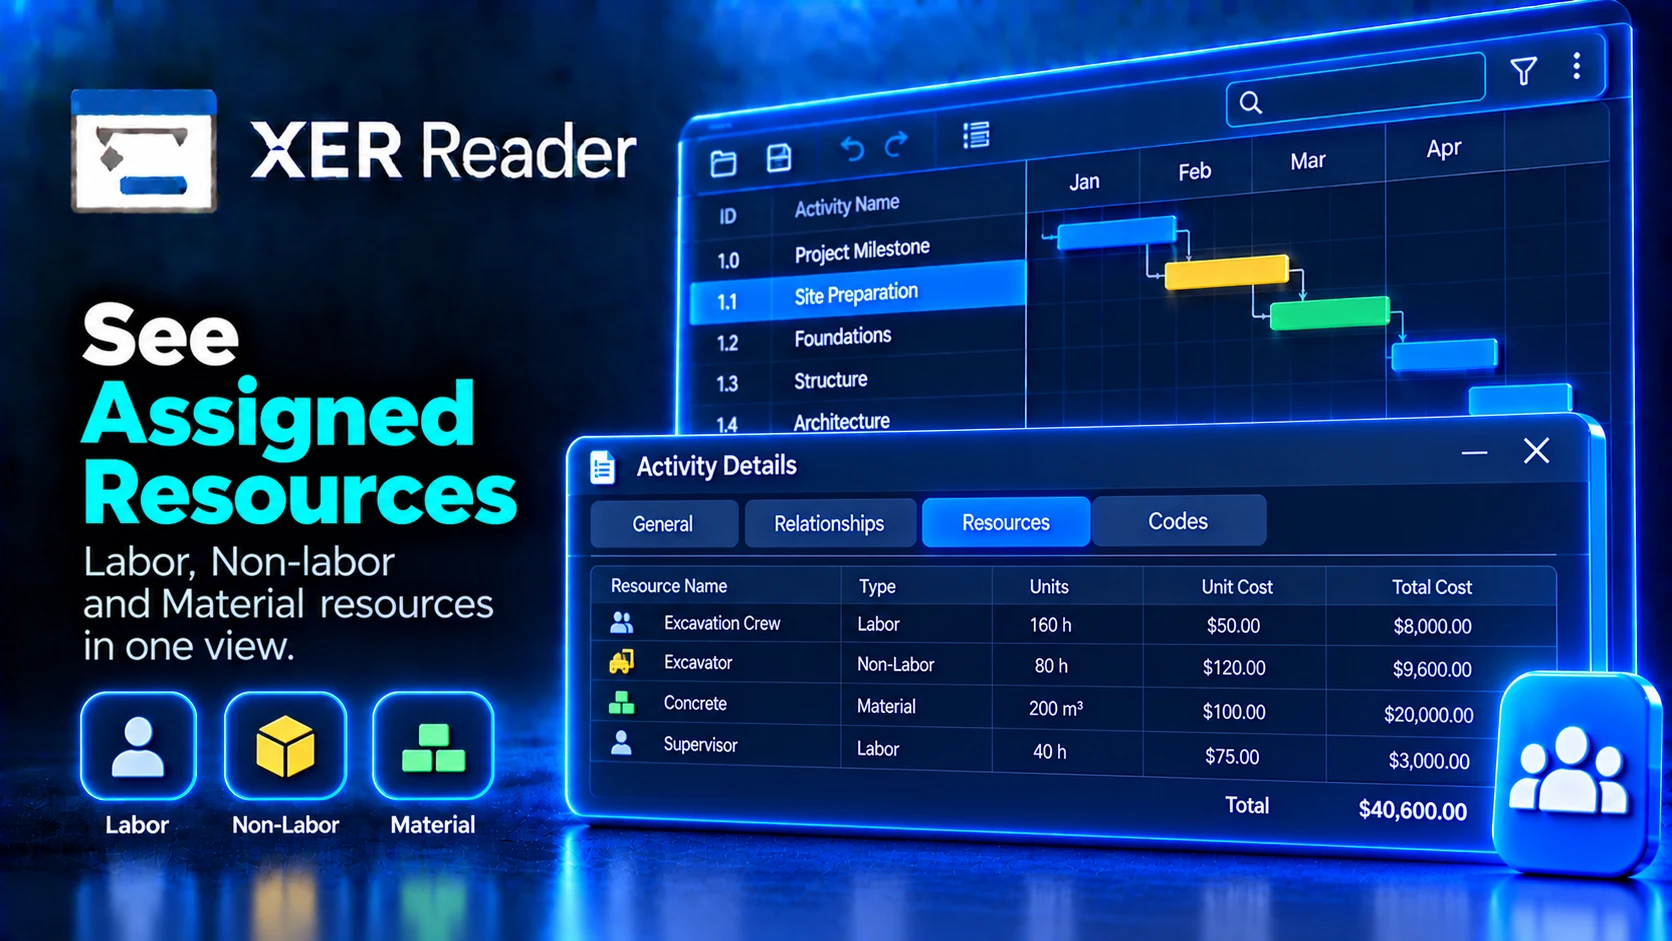
The Resources tab lists the resources assigned to the selected activity. The Resources tab covers one activity at a time. Scope This tab ans...

The Relationship tab shows the logic around the selected activity in two tables. Predecessors and successors are listed separately, each wit...
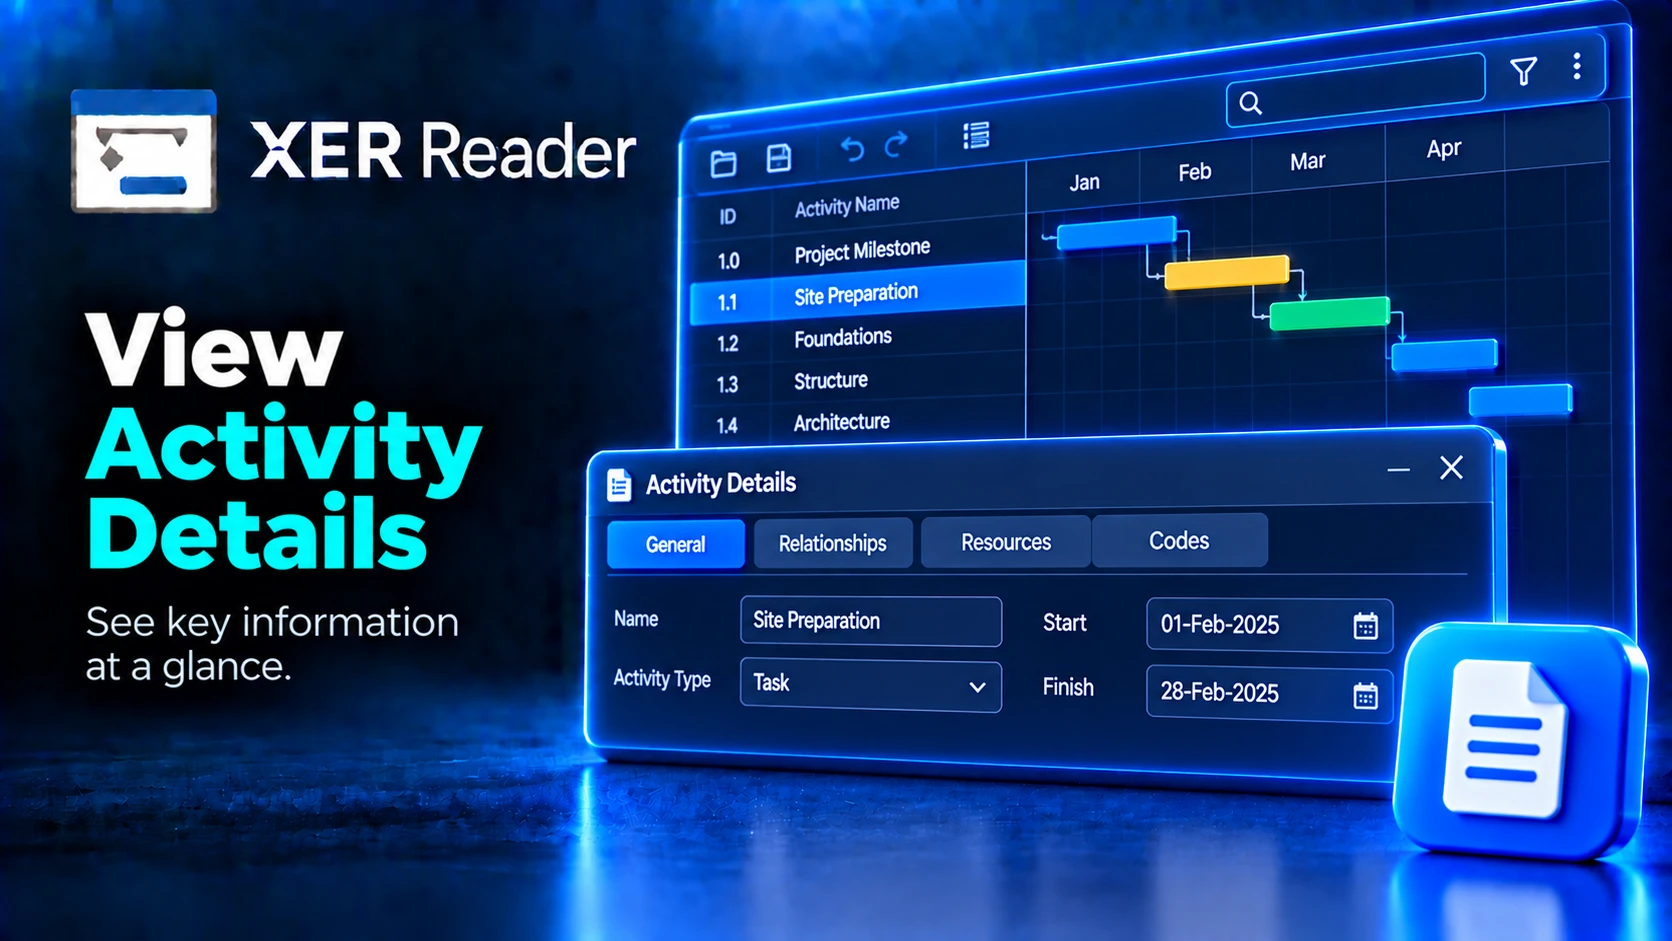
Learn how to open the Activity Details panel in XER Reader and inspect key properties on the General tab, including activity name, schedule dates, and activity type.
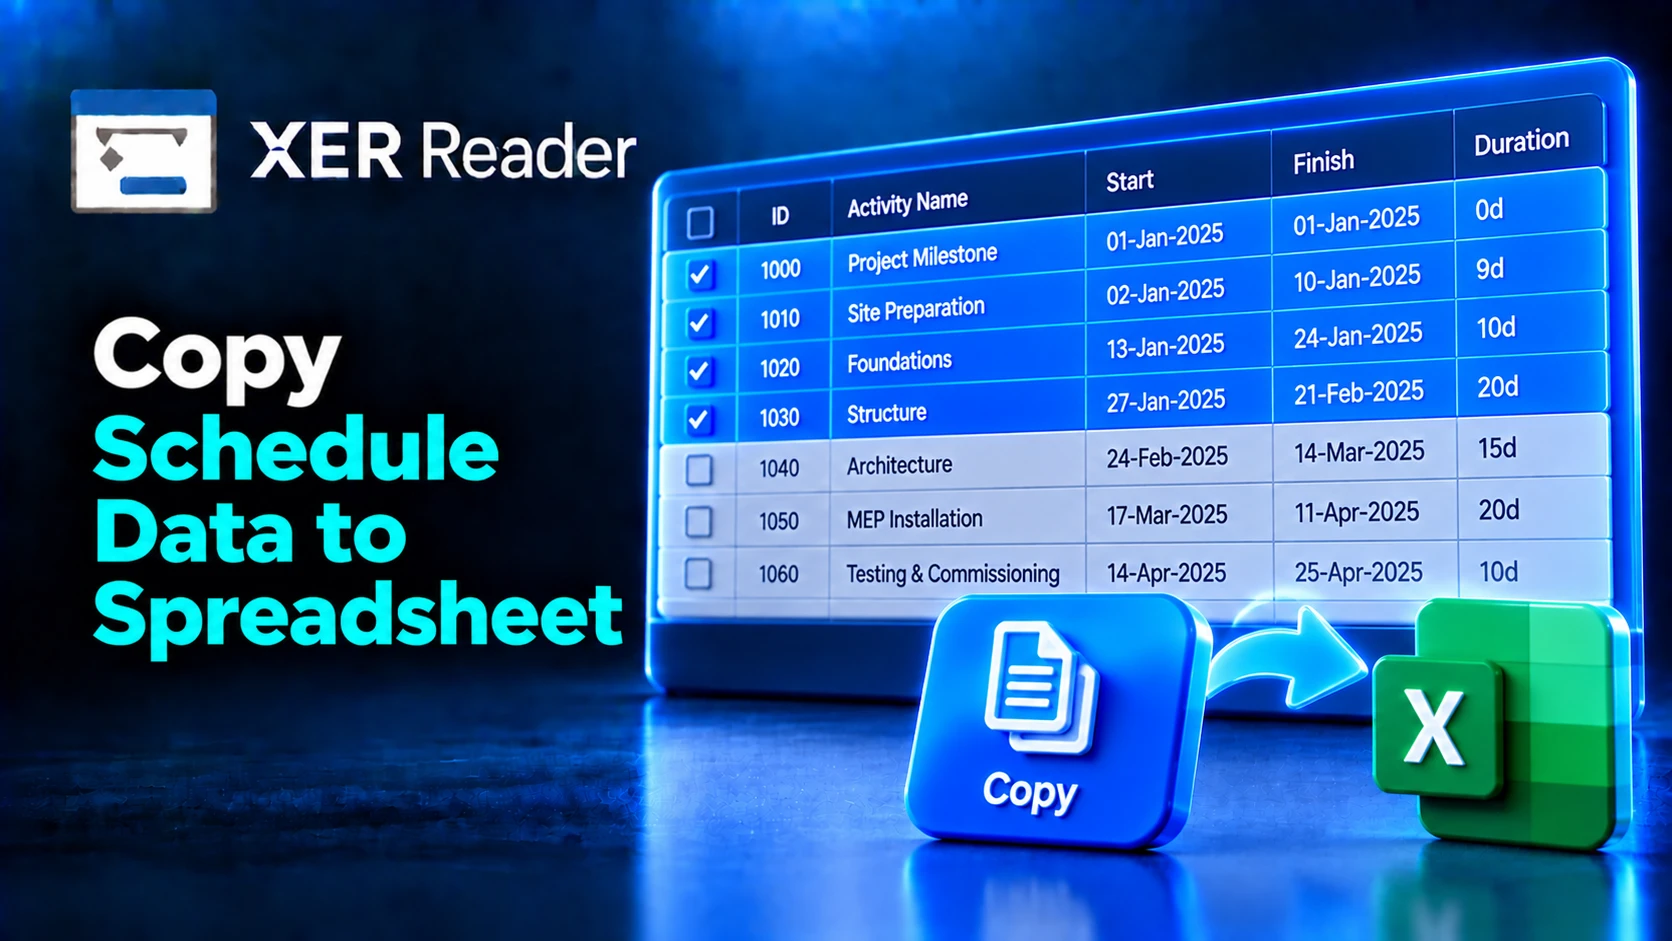
Copy places the selected activities on the clipboard in a form that pastes into a spreadsheet. Copy takes the columns currently displayed, s...
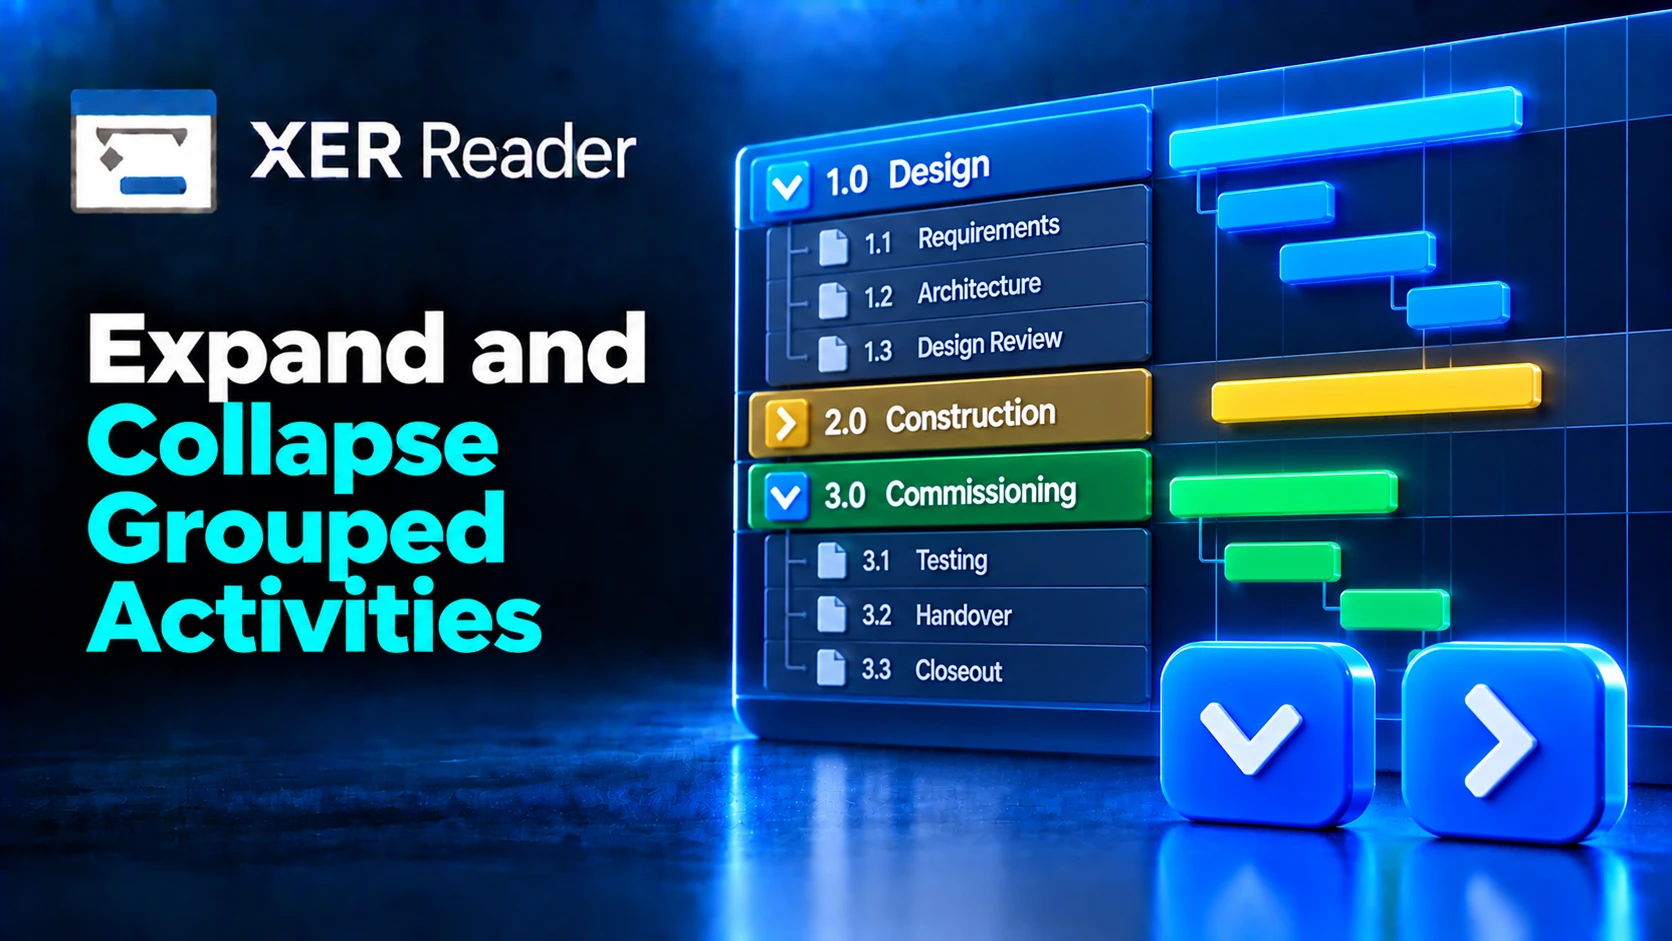
The Tree button expands and collapses the grouped hierarchy across the whole schedule. The Tree menu applies to the whole hierarchy at once....
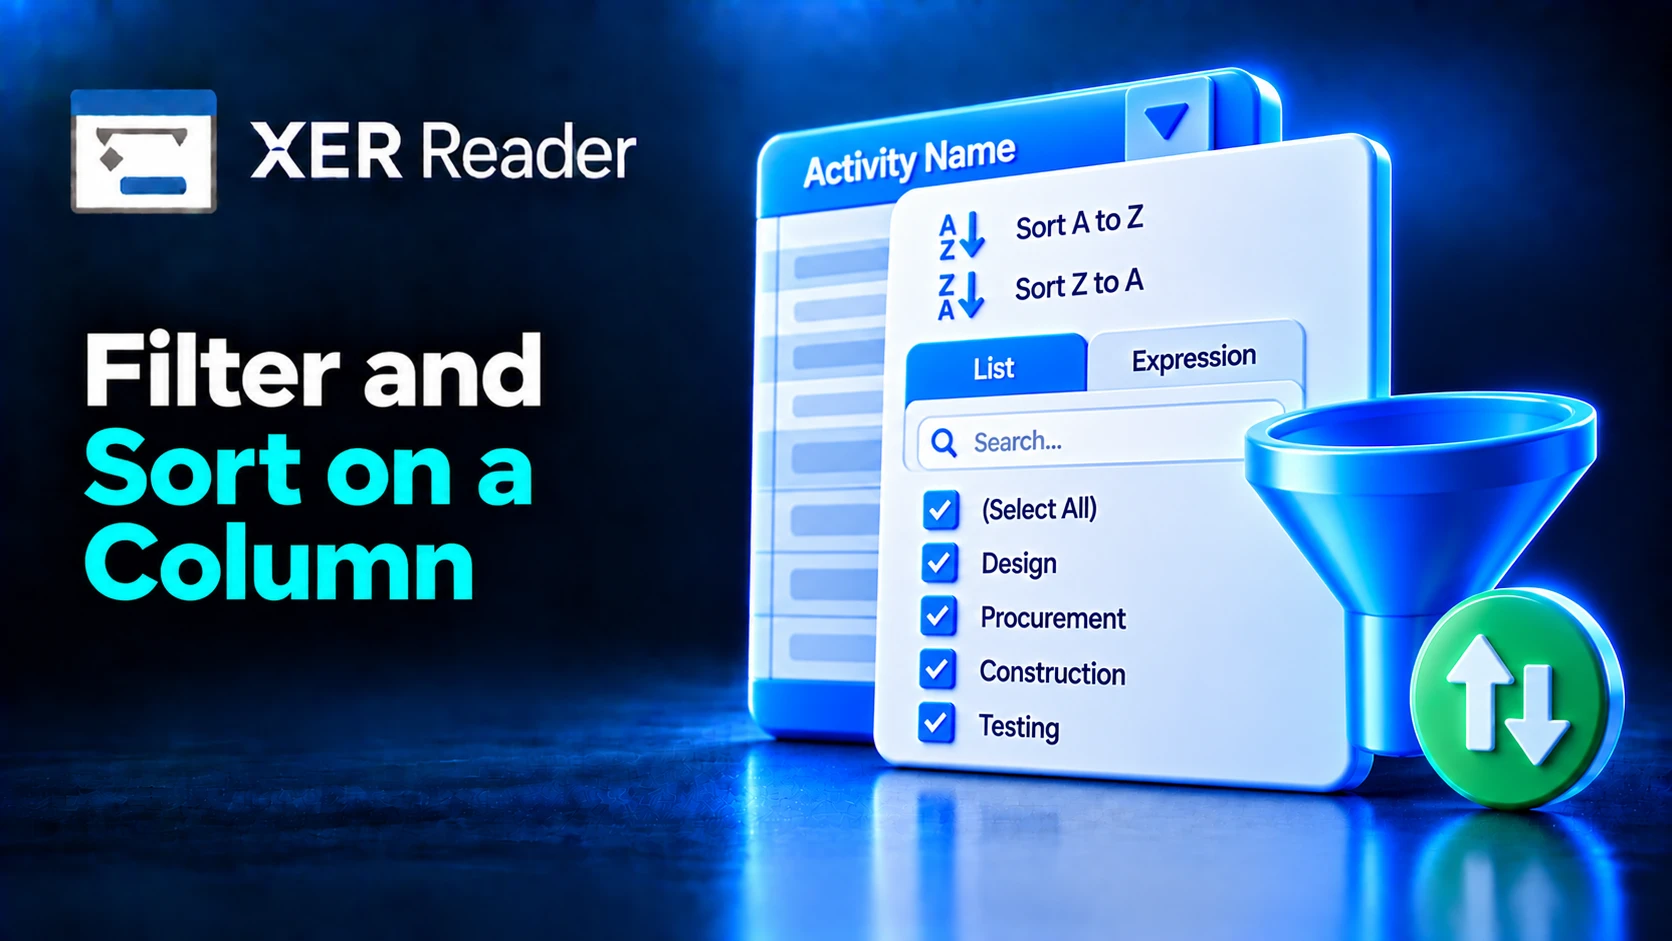
Every column header carries its own filter and sort, applied to that column only. Each column header opens its own filter and sort controls....

An expression filter built on the activity table can be named and reused. Saved filters persist between sessions and appear on the Filter me...

Four supplied filters are available on the Filter button of the Views tab. The Filter menu holds the four supplied filters, the save and man...
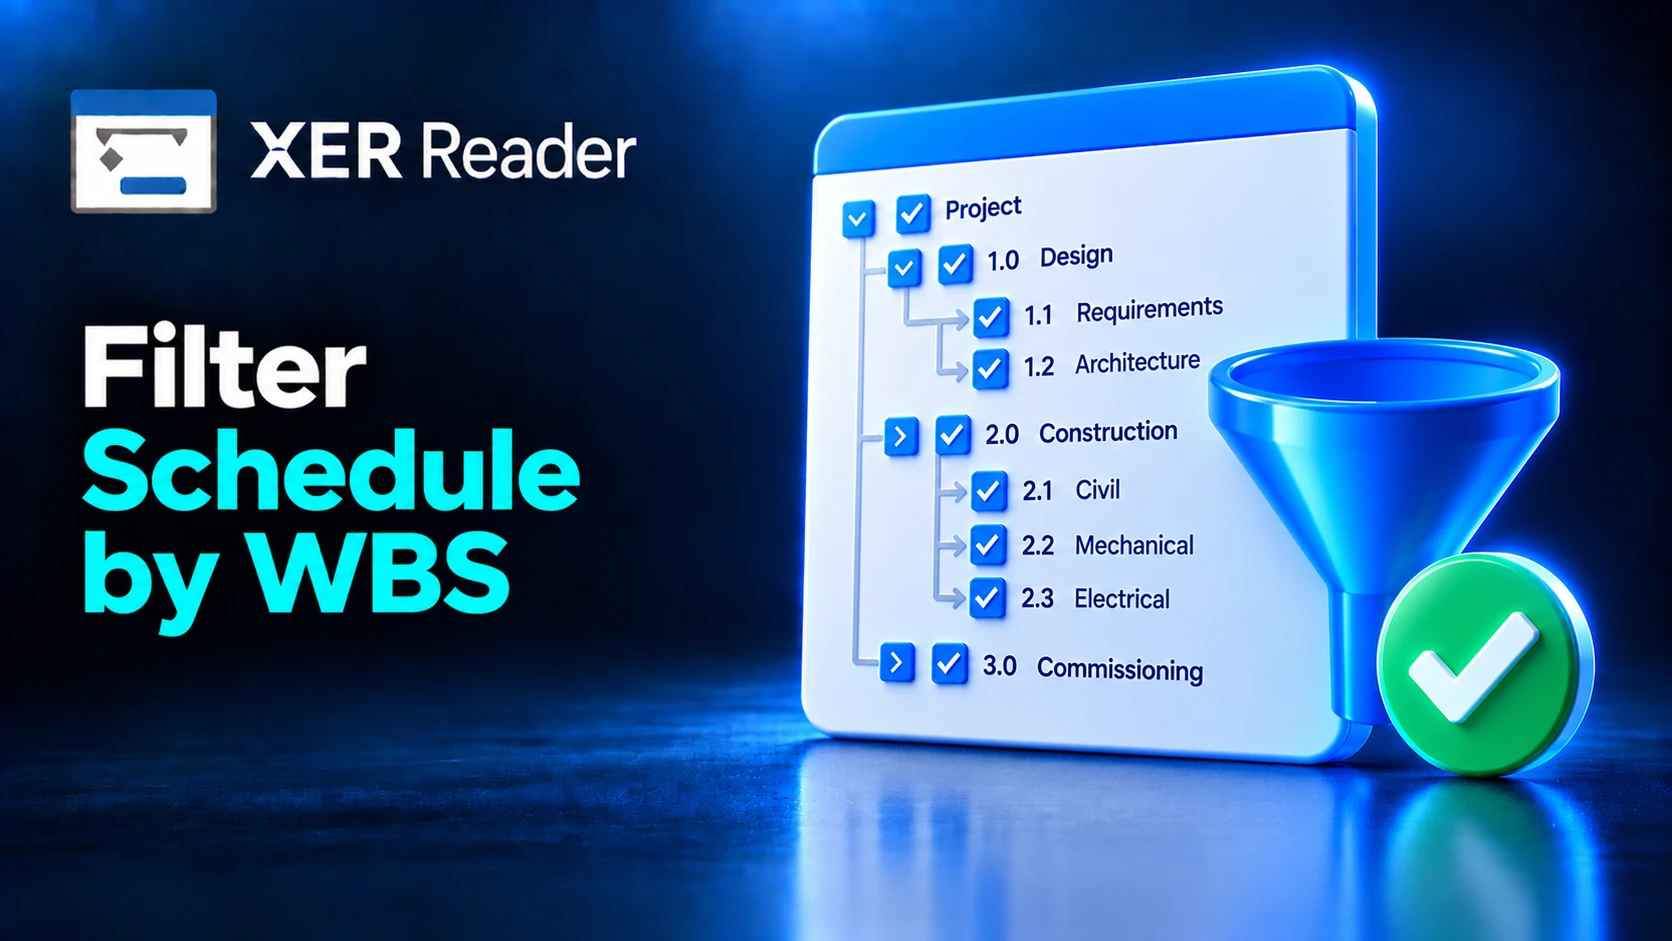
The WBS Filter restricts the activity table and the Gantt chart to one branch of the Work Breakdown Structure. The WBS Filter panel lists th...
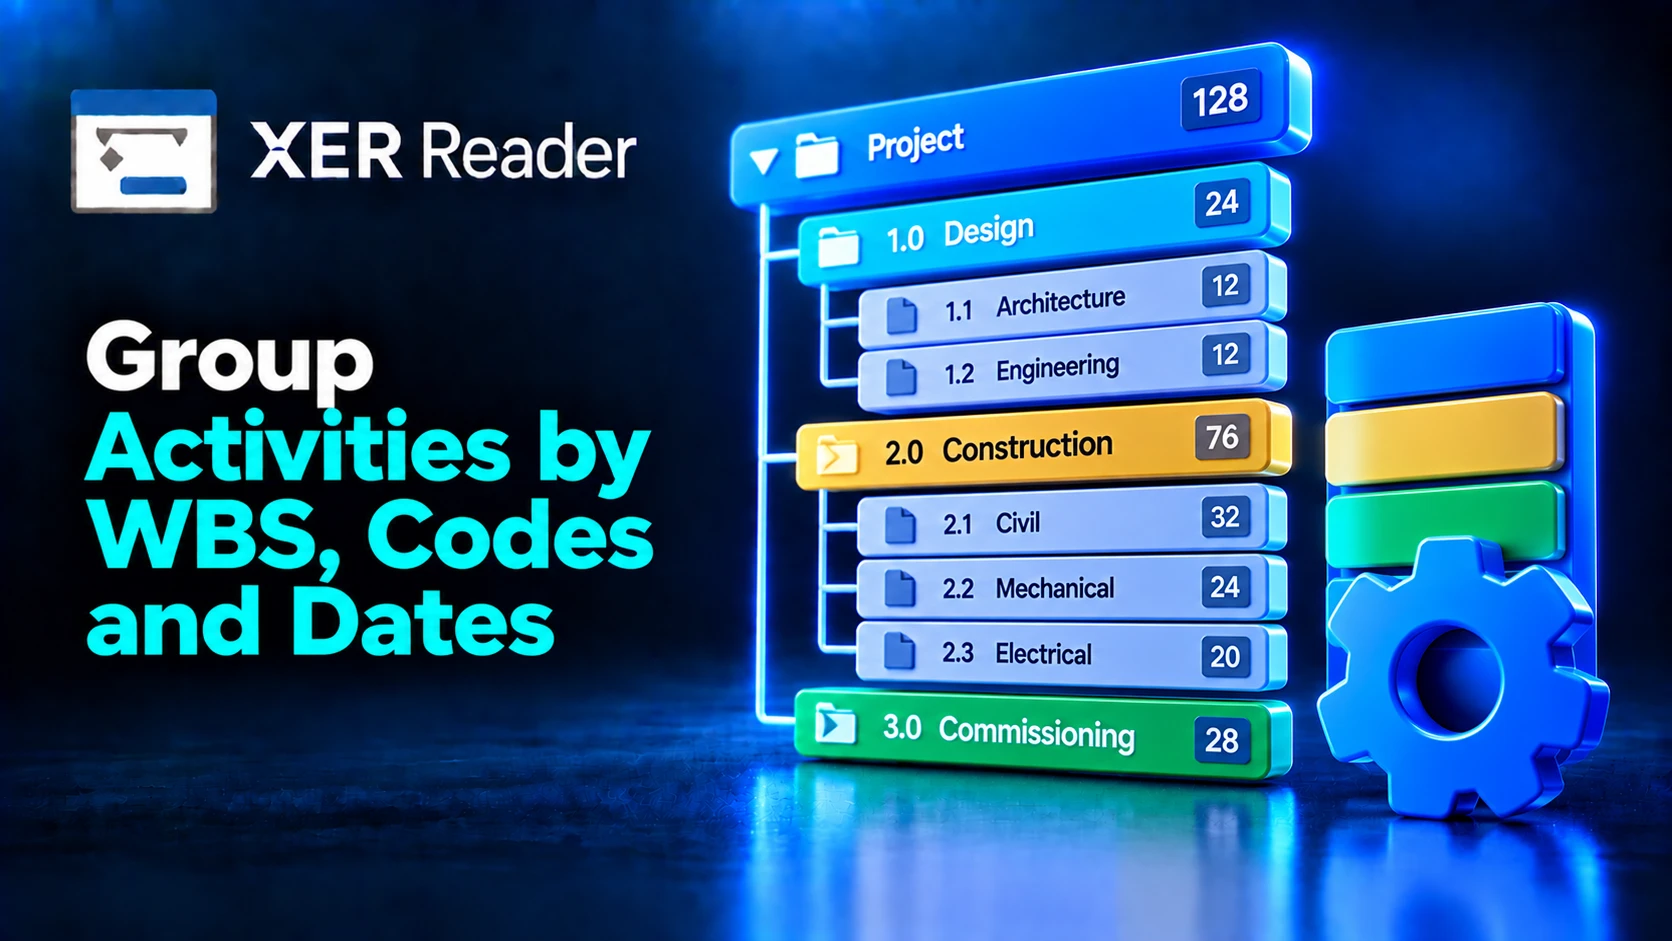
Grouping gathers activities into collapsible group rows. Rules stack, so the first rule forms the outer level and the next nests inside it....
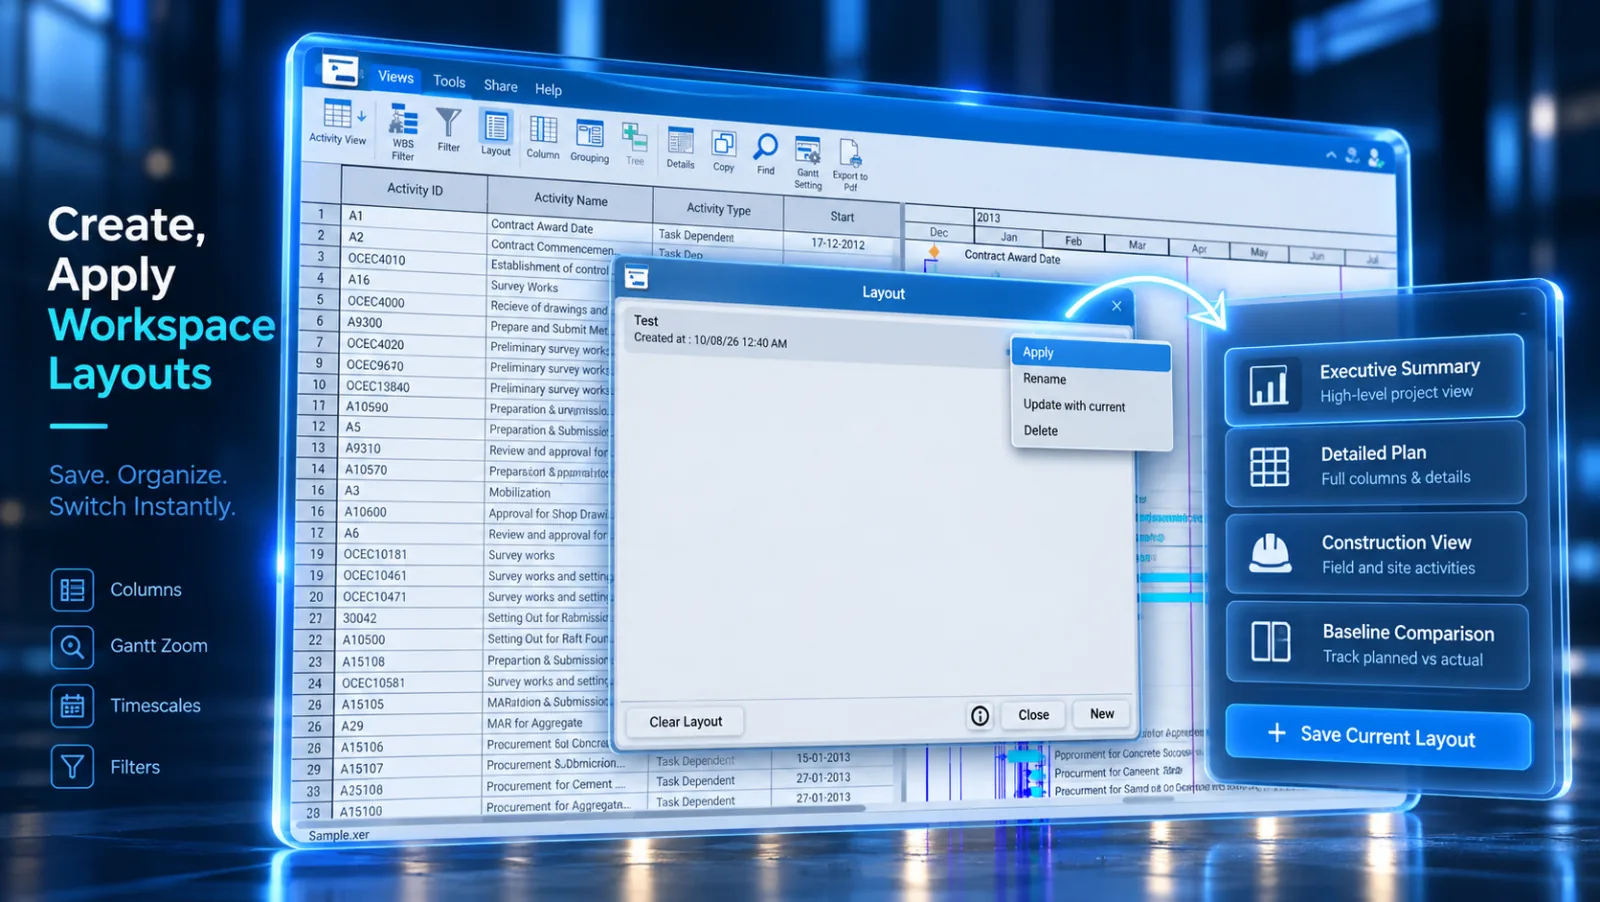
Learn how to save custom column configurations, filters, and Gantt settings into reusable layout files.
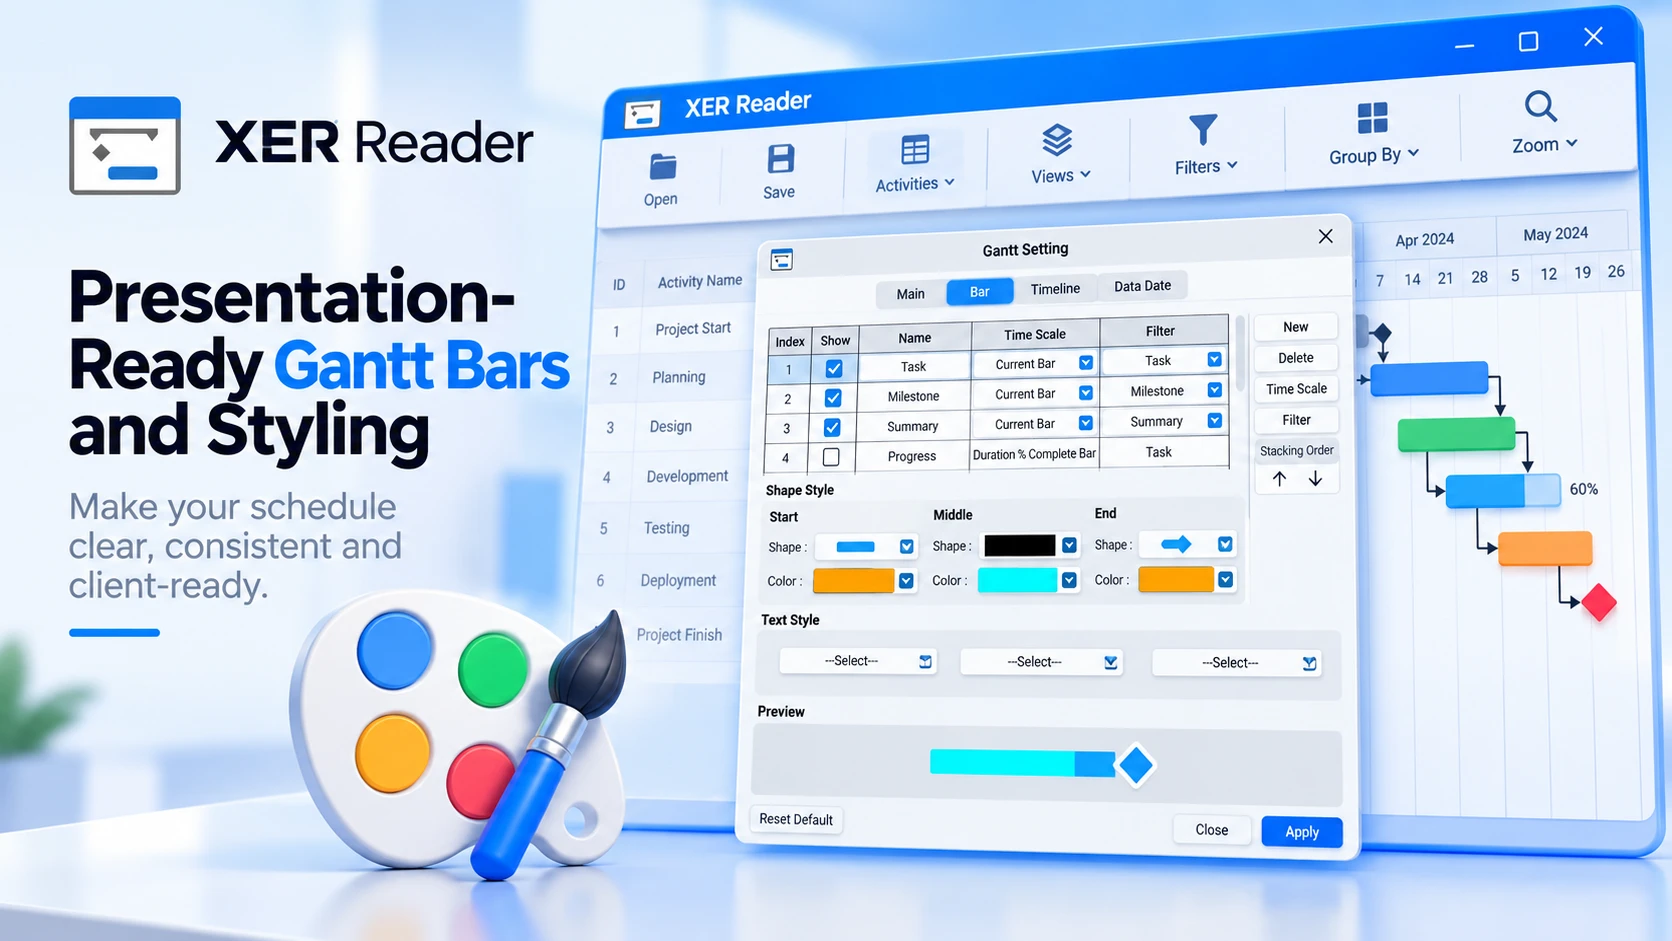
A complete guide to configuring Gantt bar styles, progress completion fills, and activity text labels in XER Reader.
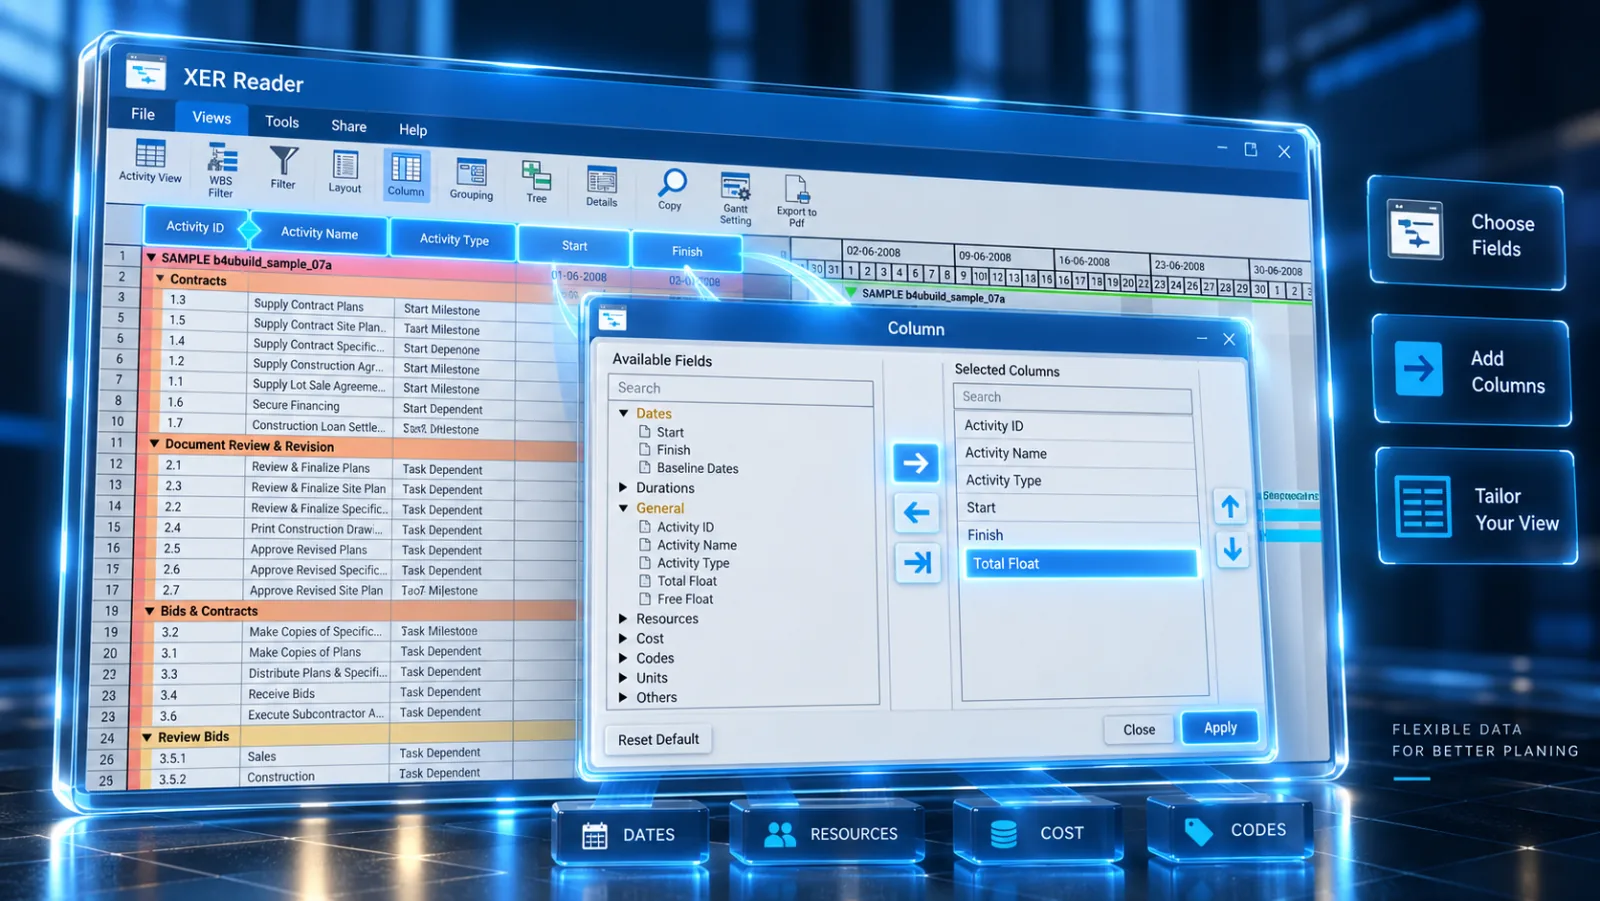
Step-by-step guide to adding, removing, and reordering data columns in the XER Reader activity table.
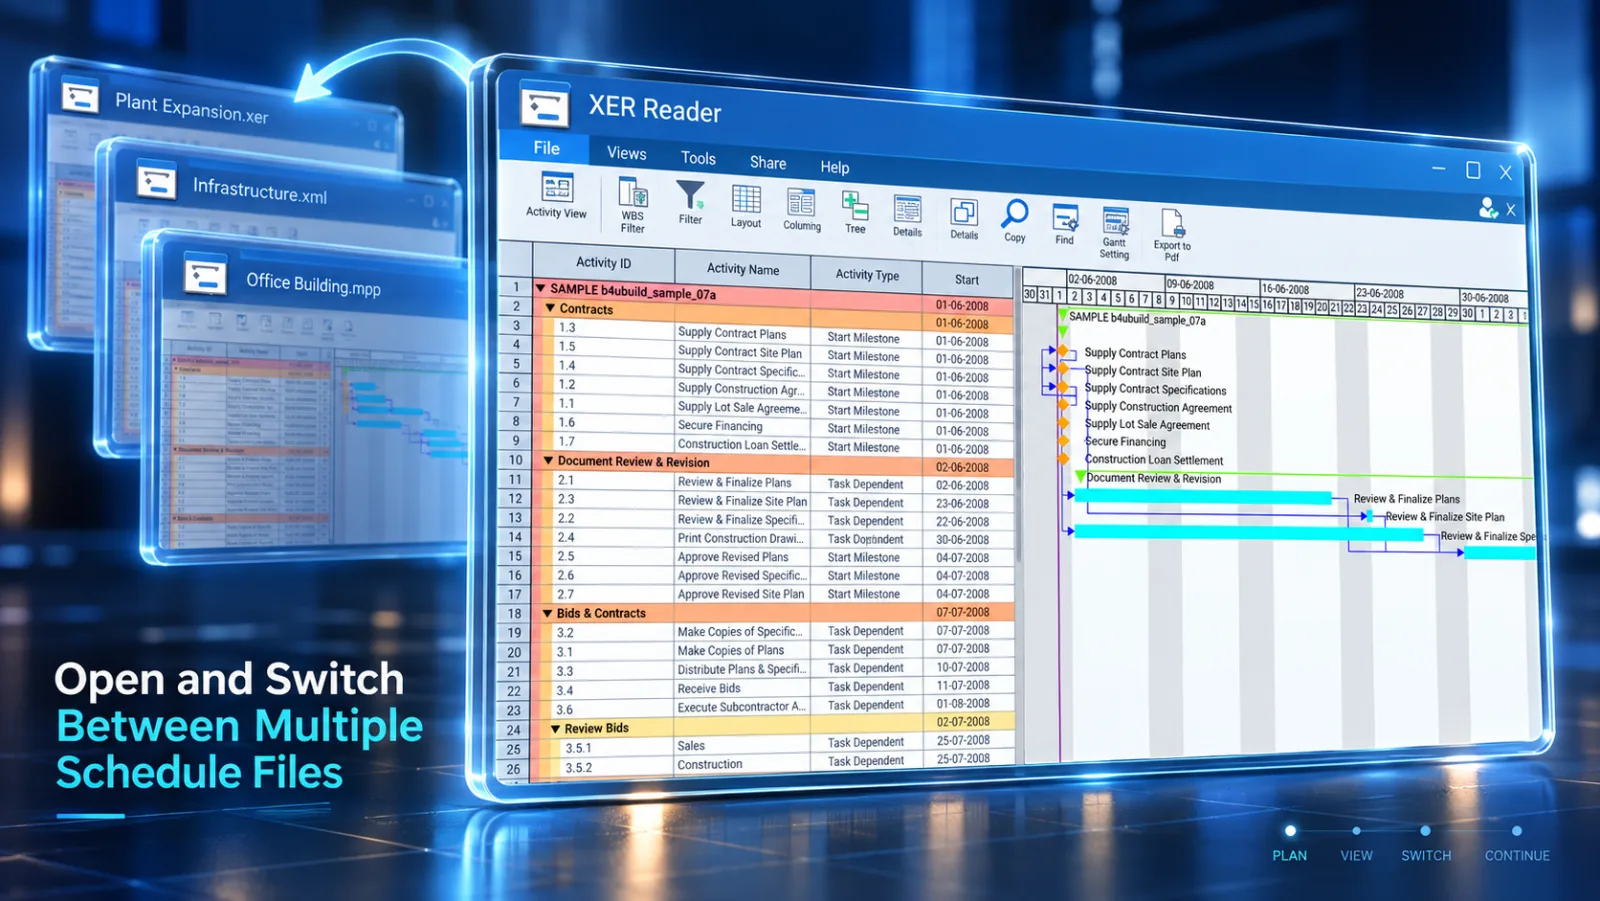
Instructions on using the Recent Files menu and switching projects between XER, MPP, and XML files.
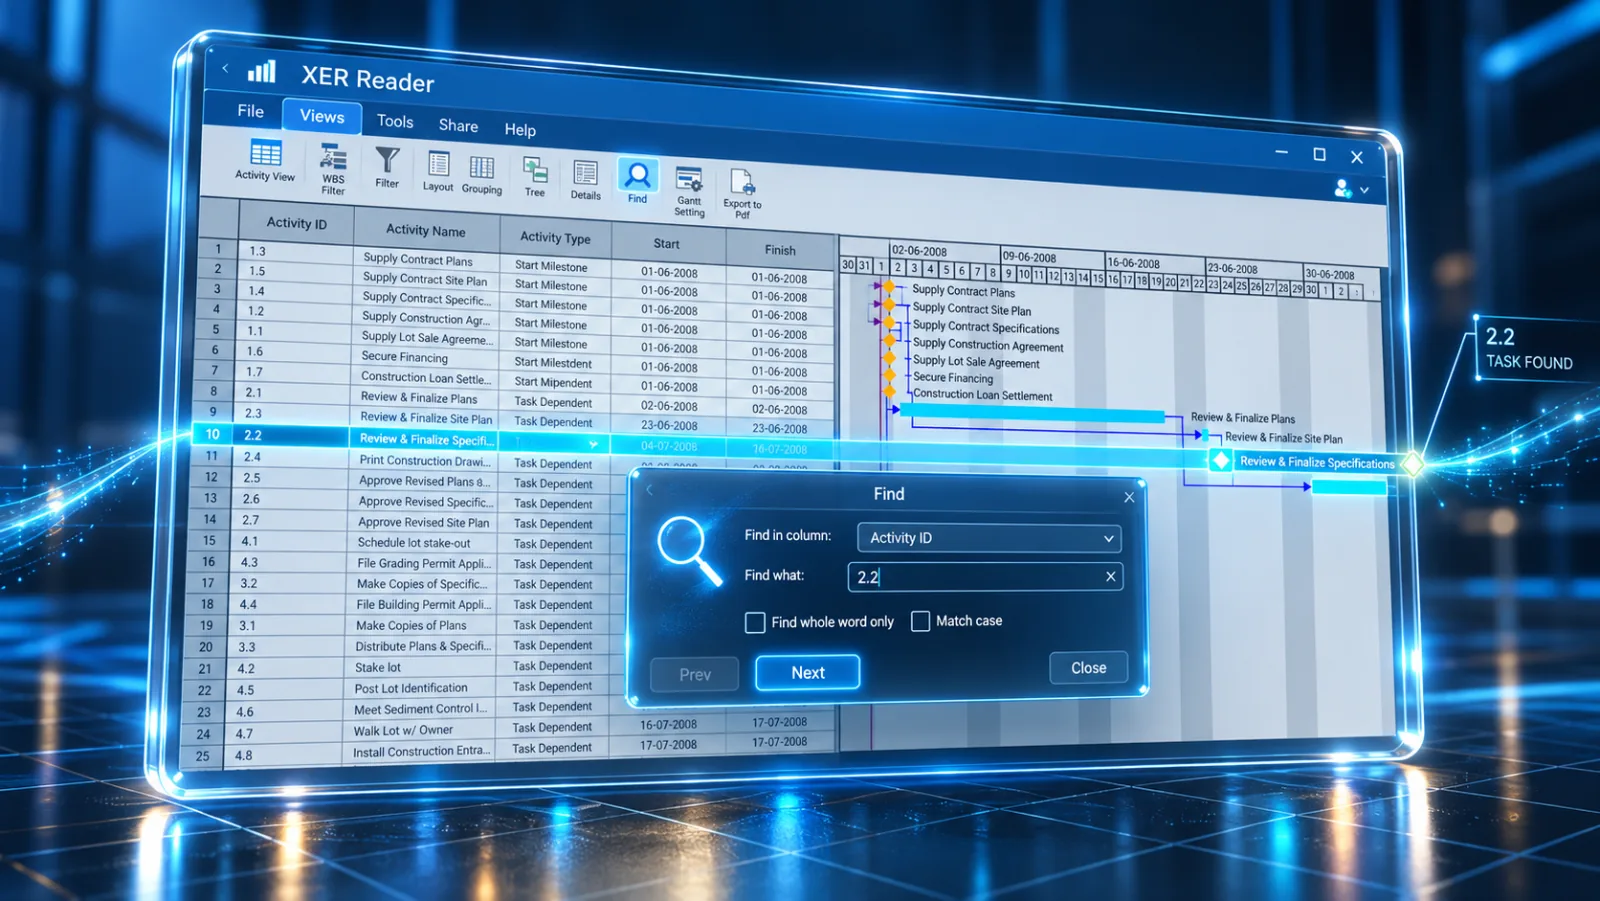
Learn how to locate activities instantly by ID, Name, or date across schedules with tens of thousands of tasks using XER Reader native Find tool.
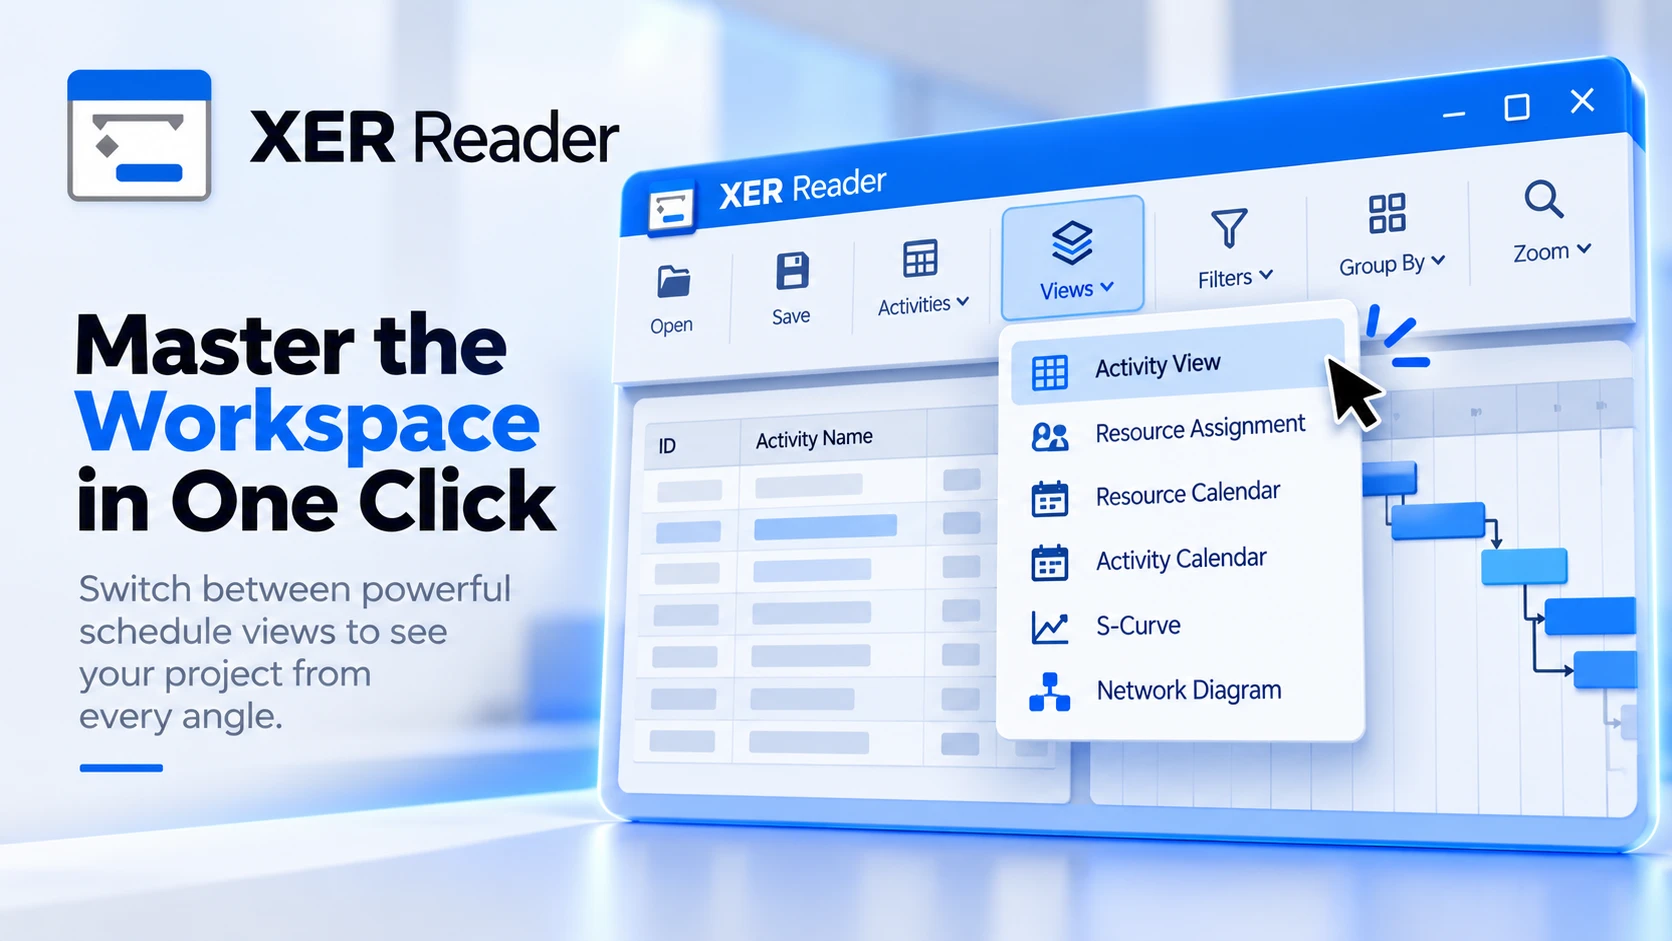
A visual guide to XER Reader navigation: the top Ribbon toolbar, 6 core schedule views, contextual view tools, and collapsible dock panels.
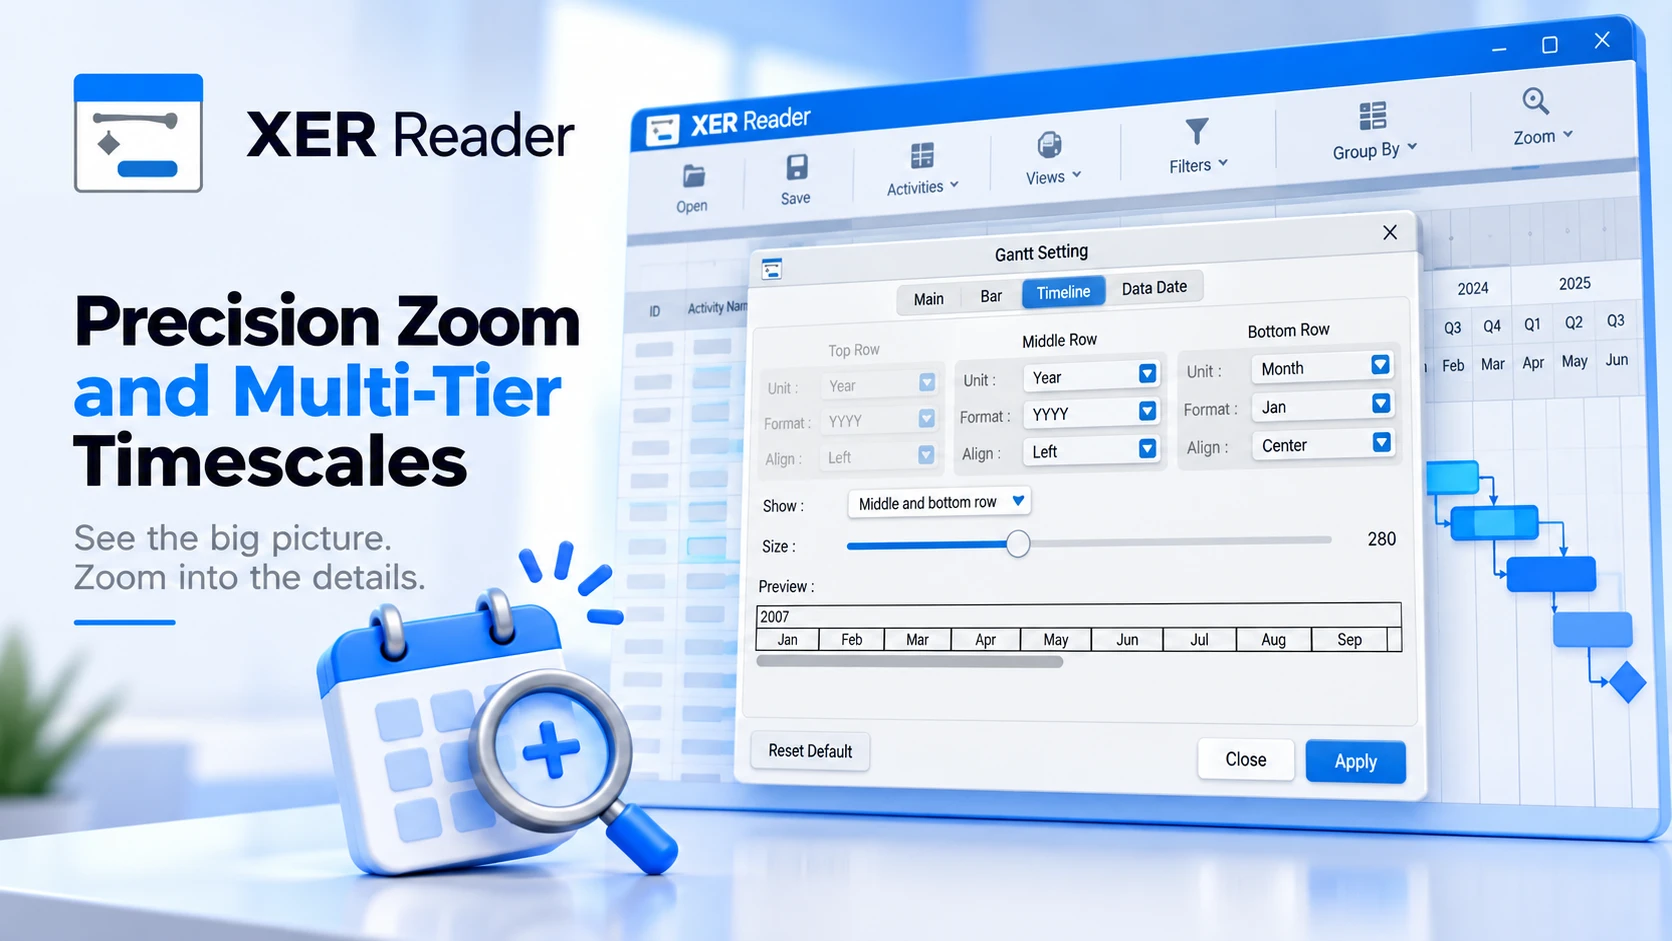
Learn how to configure Gantt chart timescale tiers, adjust zoom levels, and customize timeline units from multi-year overviews down to daily and hourly granularity in XER Reader.
Step-by-step instructions to open schedules via the File menu, drag-and-drop, and Recent Files list in XER Reader.
