

The Resource Assignment view turns the schedule inside out: instead of activities with resources hanging off them, it shows resources with the activities they are assigned to, and spreads the units across a time scale. It is one of six views behind the view button on the Views tab.
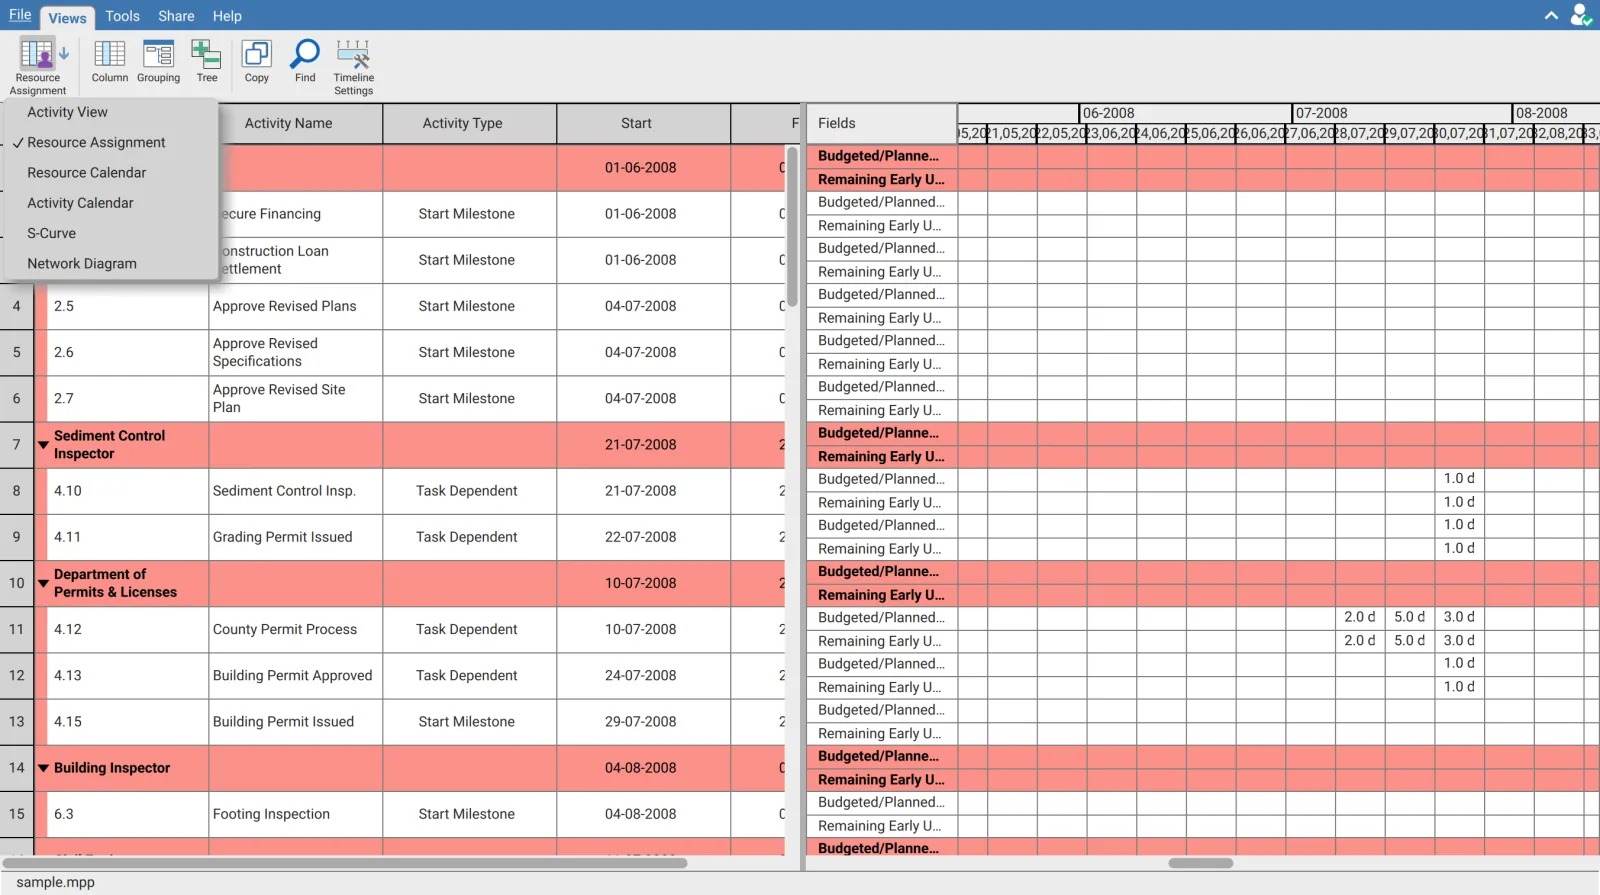
| View | Shows |
|---|---|
| Activity View | The activity table and Gantt chart |
| Resource Assignment | Activities grouped by resource, with units spread over time |
| Resource Calendar | The working calendars assigned to resources |
| Activity Calendar | The working calendars assigned to activities |
| S-Curve | Cumulative progress over time |
| Network Diagram | Activities as boxes joined by their logic |
The button label and icon change to whichever view is current, and the ticked entry in the menu is the one you are in. Switching shows Switching View ... while it works, because the resource tree is built the first time the view is opened rather than when the file loads.
The layout
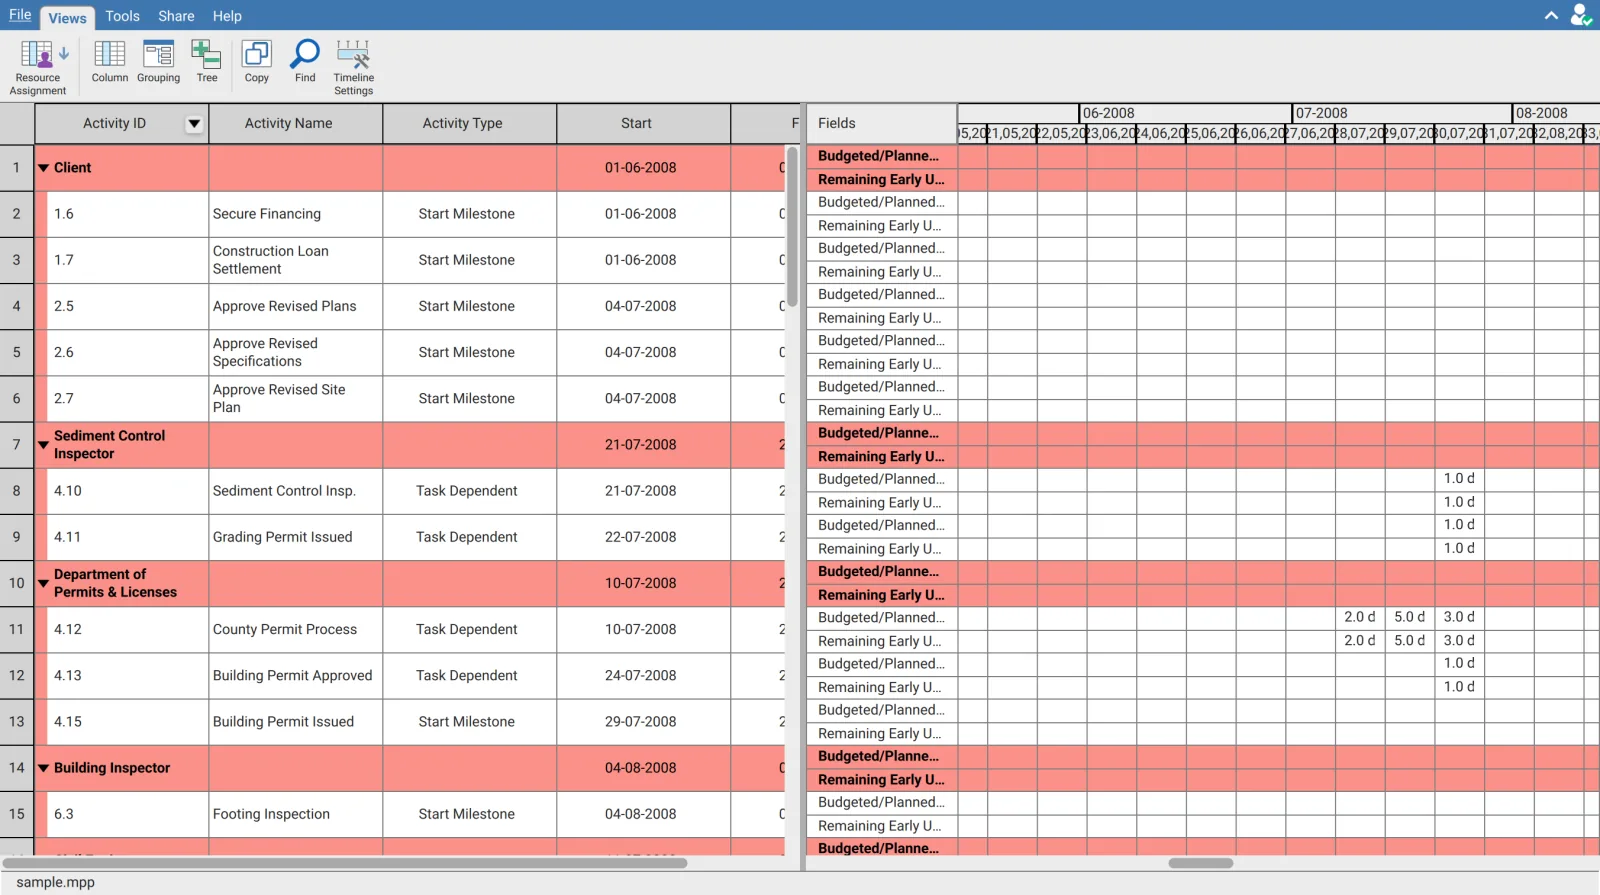
| Pane | Contents |
|---|---|
| Left | The activity table, grouped by resource |
| Right | A Fields column and the time scale, with the units in each period |
The two panes scroll together vertically and the divider between them drags.
Every activity gets two rows
The Fields column carries two rows for each activity, and the row on the left is twice the usual height to hold them.
| Field row | Value |
|---|---|
| Budgeted/Planned Units | The units planned for that assignment |
| Remaining Early Units | The units still to be done |
These two rows are fixed. The Column button changes the columns in the left table, not the field rows on the right. There is no control that adds a third field row or swaps one of these two for another quantity.
Reading the cells
A cell holds the units falling in that period, to one decimal place, followed by the time unit abbreviation. A period with nothing in it is left blank rather than showing a zero.
The unit and its abbreviation come from Preferences, not from this view. Tools then Settings holds Time Unit and the abbreviations. A cell reading 5.0 d is five days because the time unit is set to Day; switch the preference to Hour and the same assignment reads in hours. If the figures look wrong by a factor, check that setting before the schedule.
The grouping is fixed to the resource
Grouping opens the same Group Manager the activity view uses, but here the first row is already set and cannot be changed.
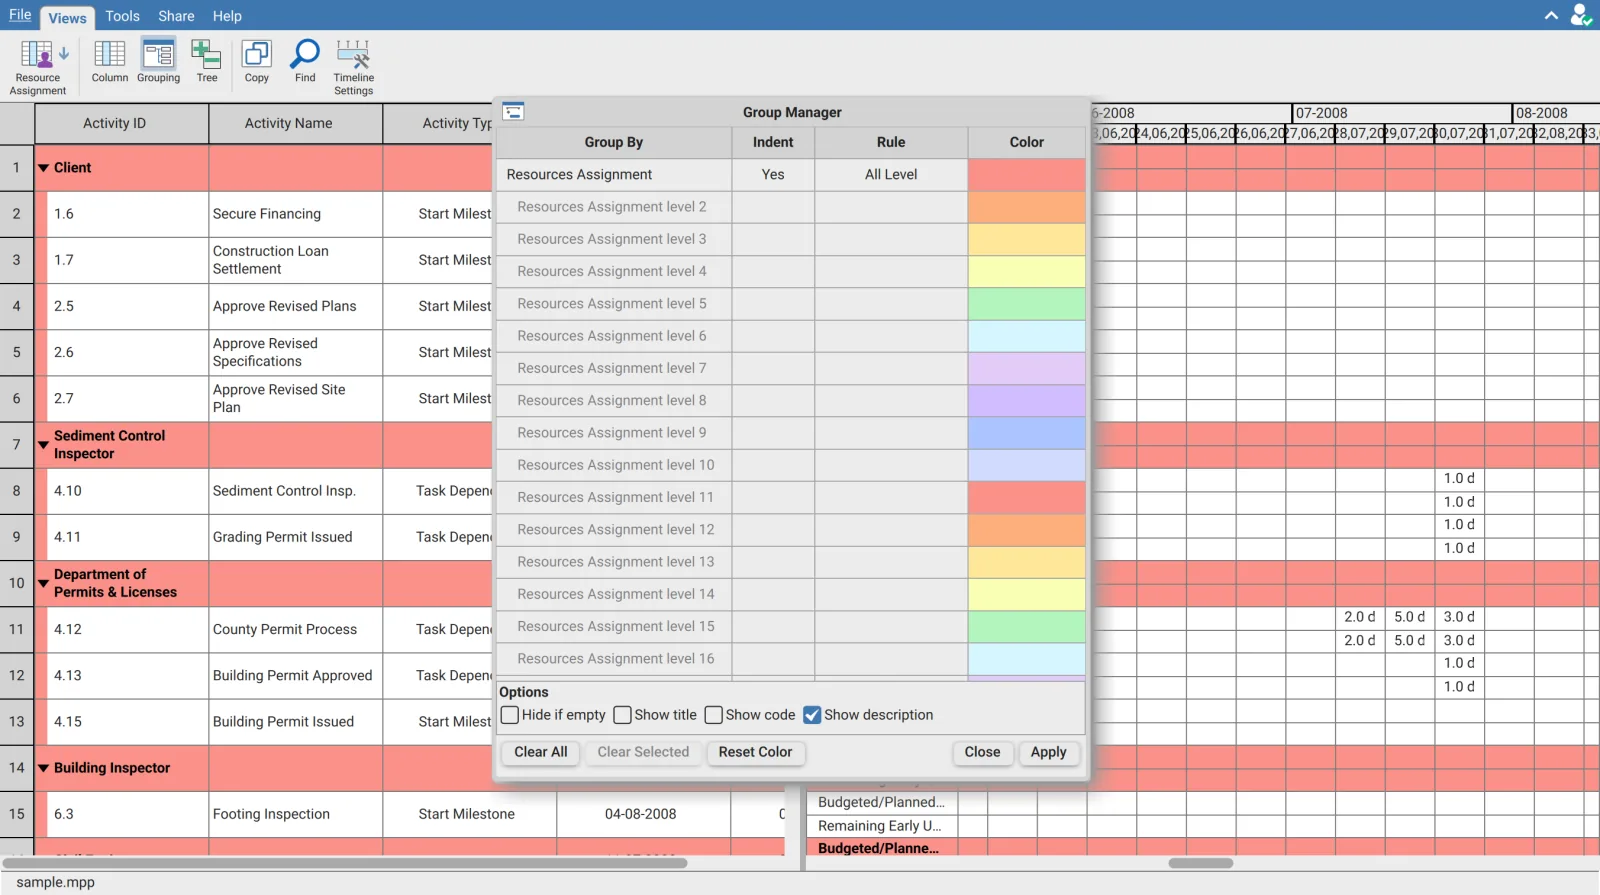
| Column | Setting |
|---|---|
| Group By | Resources Assignment, fixed |
| Indent | Yes, which is what creates the level rows below |
| Rule | All Level, or Level 1 to Level 20 to stop at a depth |
| Color | The band colour for that level |
The greyed rows named Resources Assignment level 2 onwards are not empty slots you can fill. They are the deeper levels of the same grouping, created because Indent is on, and changing the Rule adds or trims them. What you can change on them is the colour.
| Option | Effect |
|---|---|
| Hide if empty | Drops group bands that contain no activities |
| Show title | Puts the field name in the band |
| Show code | Puts the value's code in the band |
| Show description | Puts the value's description in the band |
Reset Color puts the supplied palette back. Clear All and Clear Selected act on the rows, and Apply commits.
Resources Assignment is not offered in the Activity View. The field is marked as disabled for grouping there, so you cannot group the activity table by resource. This view is the only place that grouping exists, which is the reason to come here at all.
Activities with no resource
Anything with no assignment collects under a band named No Resources Assignment. That is the general grouping behaviour, which names the empty bucket after the field, and it is worth looking at first: a large No Resources Assignment band is the same finding the Schedule Analyzer reports as the Resources check.
On a schedule with no assignments at all, every activity lands in that one band and every cell on the right is blank. The view is working; the file has nothing to show.
The group value is the resource name
The band takes its name from the resource's Resource Name. Where a resource has no name the short name is used instead, and failing that its identifier. An activity with two resources appears under both.
Setting the time scale
Timeline Settings controls the periods the units are spread across. It is the same three row timeline the Gantt chart uses, kept as a separate setting for this view.
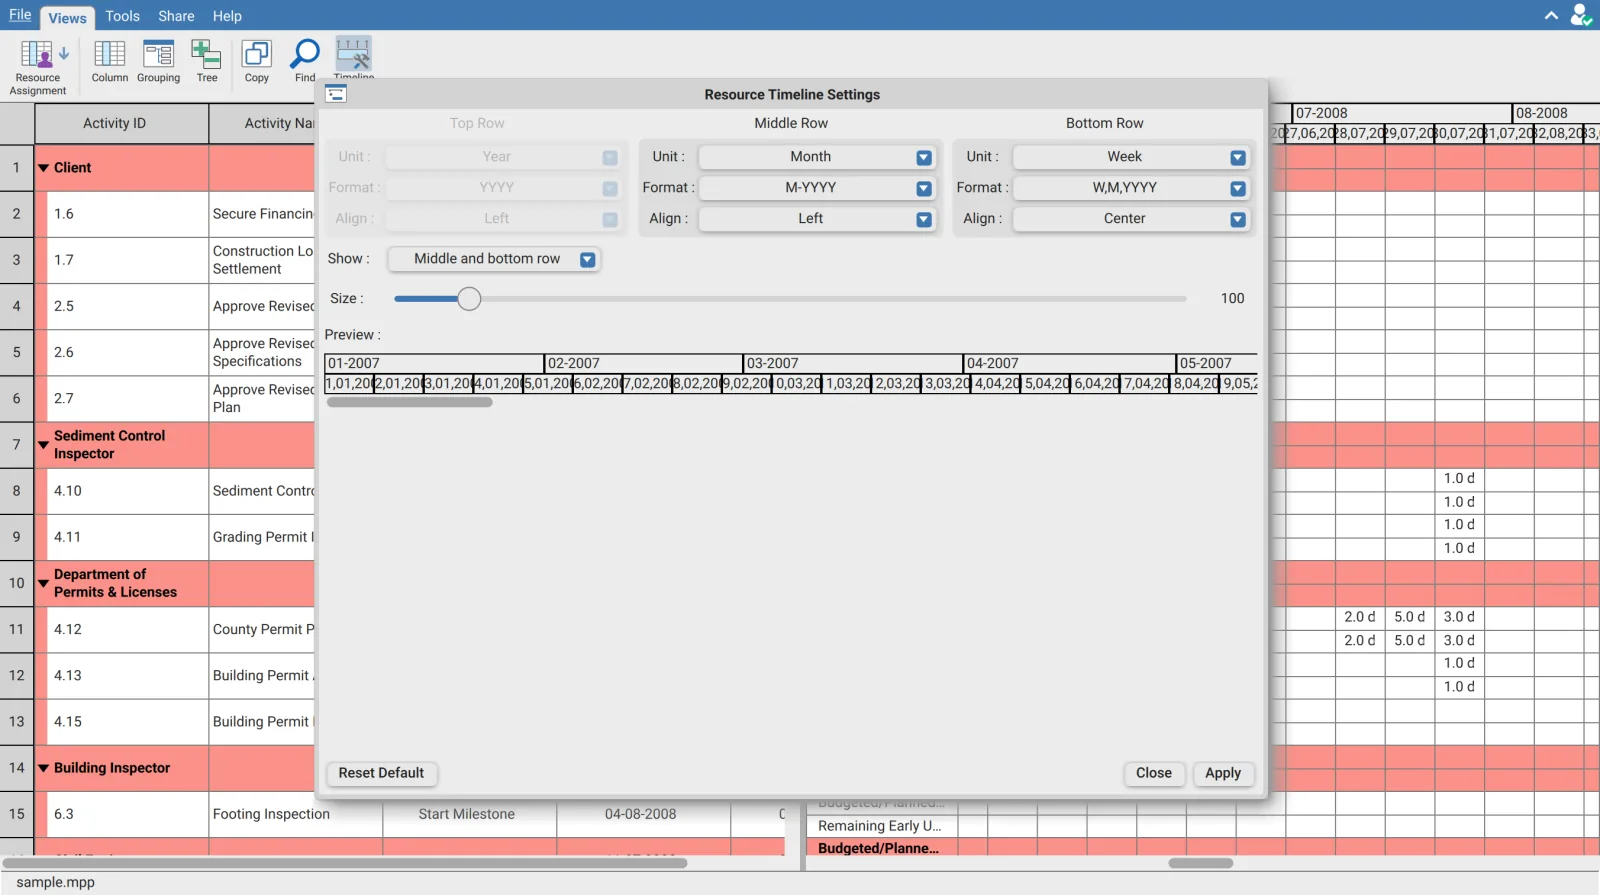
| Control | Options |
|---|---|
| Unit | Hour, Day, Week, Month, Quarter or Year |
| Format | The label format, which changes with the unit |
| Align | Left, Center or Right |
| Show | All, Middle and bottom row or Bottom row only |
| Size | Column width, 100 by default |
The greyed out Top Row is not broken. Show is set to Middle and bottom row by default, and the rows it hides are disabled. Set Show to All before trying to change the top row.
The bottom row is the one that decides the period a cell covers. It ships on Day, which puts the units in daily columns: fine for a two week look ahead, unreadable across a year. Move it to Week or Month and the same units gather into periods you can compare. The preview updates as you change it, so the shape can be settled before you apply.
The divider between the Fields column and the time scale drags, and so does the timeline itself, which resizes the columns in place.
Nothing is applied until Apply. Close discards, and Reset Default restores the supplied timeline.
Selecting a block of cells
The time scale pane has its own selection, separate from the row selection in the left table. Click a cell to select it, and hold Shift while clicking another to take the rectangle between them, across both field rows and as many periods as you drag over.
A selected block copies to the clipboard as tab separated values, one line per field row, which pastes into a spreadsheet with the periods as columns. The standard copy command does it.
Copy on the ribbon does something different. It copies the selected rows of the left table, the activity columns. The units on the right come out through the cell selection described above. Two selections, two clipboards worth of data, and picking the wrong one is the usual reason a paste arrives without the numbers.
The rest of the ribbon
| Button | Effect |
|---|---|
| Column | Chooses the columns in the left table |
| Grouping | Opens the Group Manager described above |
| Tree | Expand All, Collapse All, or Level 1 to Level 10 |
| Copy | Copies the selected rows of the left table |
| Find | Searches the left table |
| Timeline Settings | Opens the timeline dialog |
The view opens with every band expanded. Tree is the control that expands and collapses them, and it acts on the activity table on the left: the time scale pane follows it rather than responding to clicks of its own.
Requirements
Requires an open schedule and a signed in account. Resource data has to be present in the file: a schedule with no assignments shows the view with a single empty band.