

The Schedule Analyzer runs 19 checks against an open schedule and reports each one as a pass or a fail against a configurable limit. It is on the Tools tab, under Schedule Analyzer.
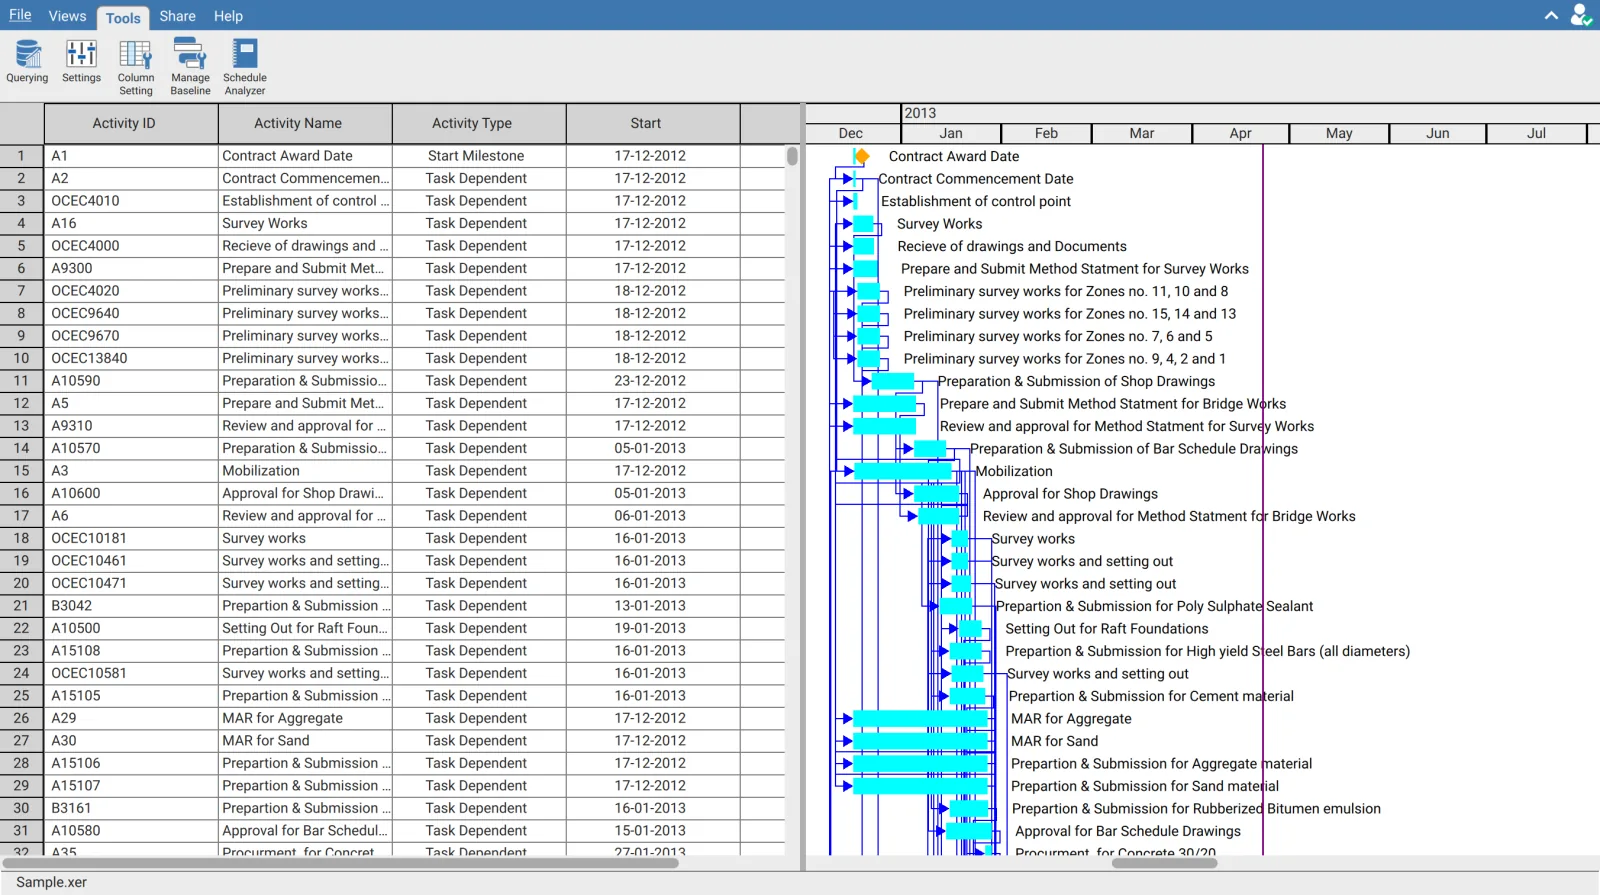
The analysis starts on its own
Clicking Schedule Analyzer opens a full window view titled Schedule Health Assessment and immediately runs the analysis against every project in the file. There is no separate step to start it the first time.
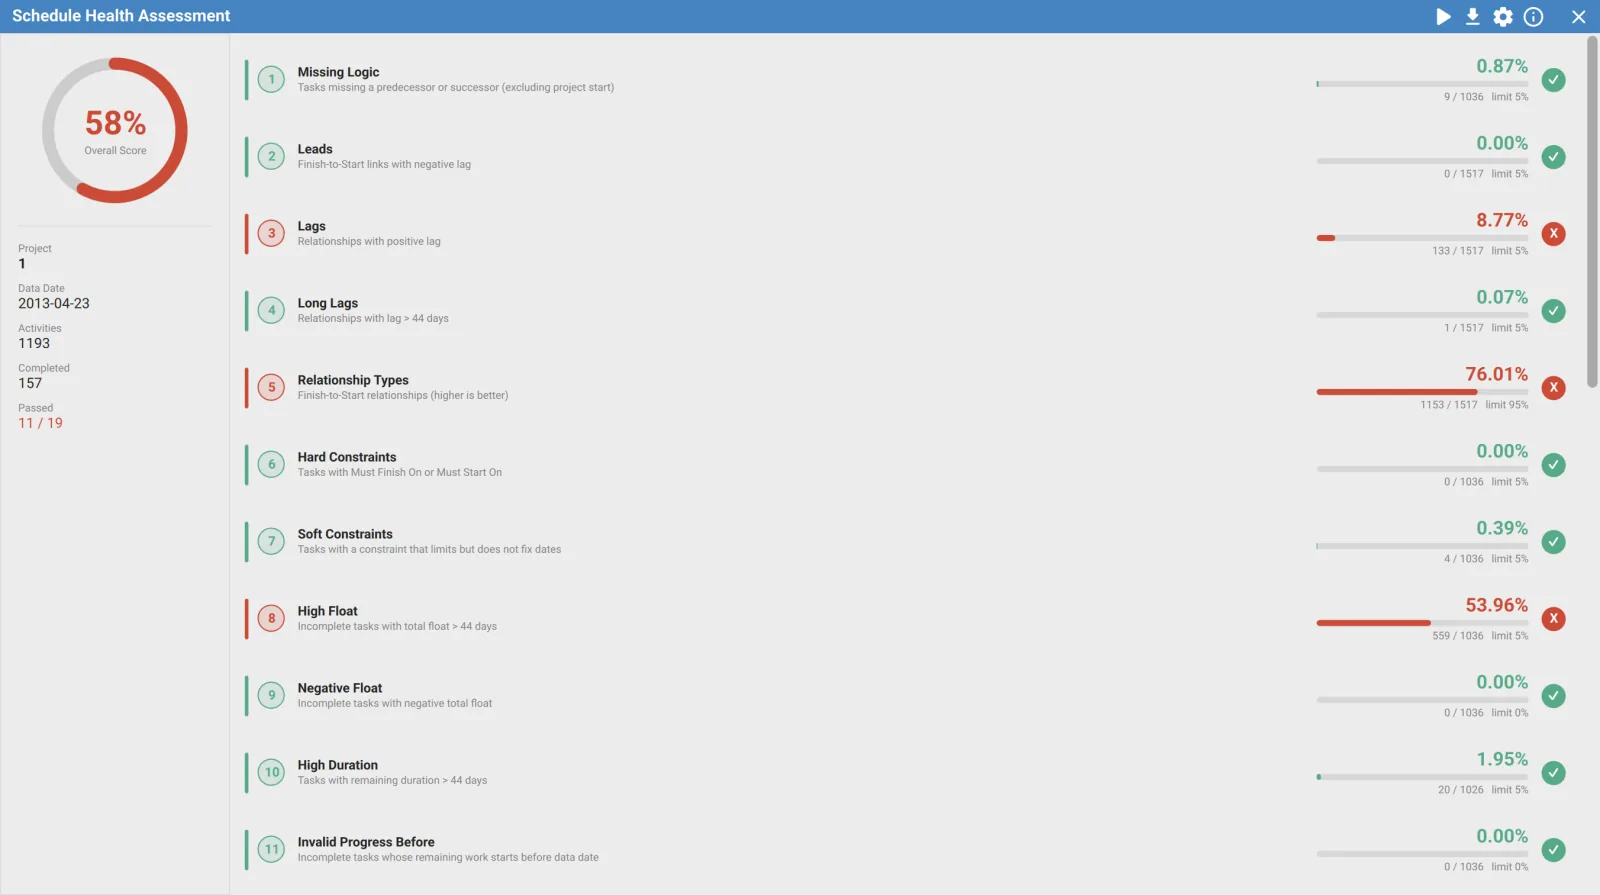
Reading the left panel
| Entry | Meaning |
|---|---|
| Overall Score | The percentage of checks that passed. Green at 90 and above, amber from 70, red below 70 |
| Project | The project name the figures relate to |
| Data Date | The project data date the checks are measured against |
| Activities | Total activity count |
| Completed | Activities already finished |
| Passed | Checks passed out of checks run |
Overall Score is a count, not a weighting. It is passed checks divided by checks run. A schedule failing four minor checks scores the same as one failing four severe checks, so read the cards rather than stopping at the number.
Reading a metric card
Every check draws the same card: a numbered badge, the check name, what it looks for, the measured value, the count it came from, the limit, and a pass or fail badge on the right.
| Element | Meaning |
|---|---|
| Value | The measured result, as a percentage or as a ratio |
| Count / total | The offending items over the population the check divided by |
| limit | The configured threshold the value is compared against |
| min | Used instead of limit on the ratio checks, where the value must reach the figure rather than stay under it |
| Green tick | Pass |
| Red cross | Fail |
Relationship Types is the check that reads backwards. It is higher is better: the card shows the percentage of Finish to Start relationships and a limit of 95 percent, and it fails when the value is below that figure. Every other percentage check fails when the value is above its limit. CPLI and BEI work the same way and are labelled min rather than limit.
The 19 checks
| # | Check | What it counts |
|---|---|---|
| 1 | Missing Logic | Incomplete activities missing a predecessor or successor, excluding the project start |
| 2 | Leads | Finish to Start links with negative lag |
| 3 | Lags | Relationships with positive lag |
| 4 | Long Lags | Relationships with lag above the configured day count |
| 5 | Relationship Types | Finish to Start relationships, as a share of all of them. Higher is better |
| 6 | Hard Constraints | Activities with Must Start On, Must Finish On, Mandatory Start or Mandatory Finish |
| 7 | Soft Constraints | Activities with a constraint that limits dates without fixing them |
| 8 | High Float | Incomplete activities with total float above the configured day count |
| 9 | Negative Float | Incomplete activities with total float below zero |
| 10 | High Duration | Incomplete non milestone activities with remaining duration above the configured day count |
| 11 | Invalid Progress Before | Incomplete activities whose remaining work starts before the data date |
| 12 | Invalid Progress After | Activities with actual dates after the data date |
| 13 | Resources | Non milestone activities with no resource assignment |
| 14 | Late Activities | Active activities whose early finish is later than baseline finish |
| 15 | CPLI | Critical Path Length Index, a ratio. Higher is better |
| 16 | BEI | Baseline Execution Index, a ratio. Higher is better |
| 17 | Dangling Start Activities | Activities with predecessors but no FS or SS link driving their start |
| 18 | Dangling Finish Activities | Activities with successors but no FS or FF link driven by their finish |
| 19 | Out of Sequence | Activities progressed before the predecessor reached the state its relationship requires |
Checks 6 to 10 exclude Level of Effort and WBS summary rows, and 10 and 13 also exclude milestones. That is why the count / total denominator differs between cards on the same schedule. A denominator that looks wrong is usually one of these exclusions rather than a fault.
What the checks measure against
| Denominator | Used by |
|---|---|
| Incomplete relationships | Leads, Lags, Long Lags, Relationship Types |
| Incomplete activities | Missing Logic, Hard and Soft Constraints, High Float, Negative Float |
| Incomplete non milestone activities | High Duration, Late Activities |
| All non milestone activities | Resources |
| All activities | Dangling Start, Dangling Finish, Out of Sequence |
BEI divides completed non milestone activities by the activities the assigned Project Baseline says should have finished by the data date. With no baseline assigned the denominator becomes all non milestone activities, which makes the figure look far worse than the schedule deserves.
BEI and Late Activities both need a baseline. Assign one under Manage Baseline on the same Tools tab before reading either. Without one, BEI is measured against every non milestone activity in the project.
The charts
Below the cards, seven charts break the same data down by distribution rather than by pass and fail.
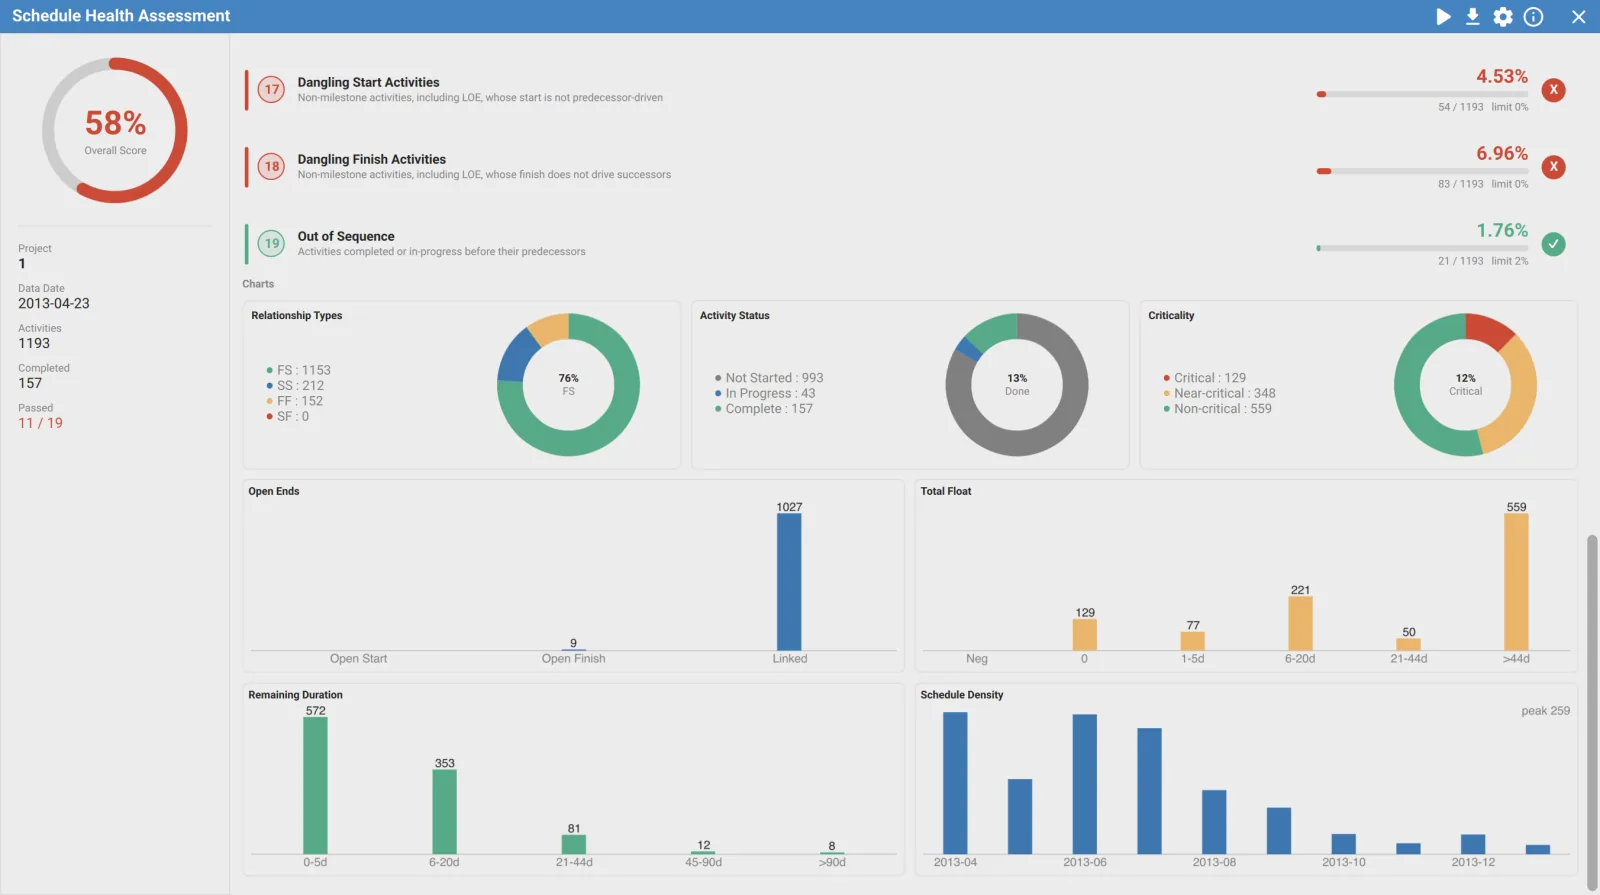
| Chart | Breakdown |
|---|---|
| Relationship Types | FS, SS, FF and SF counts, with the FS share in the centre |
| Activity Status | Not Started, In Progress and Complete |
| Criticality | Critical, Near critical and Non critical |
| Open Ends | Open Start, Open Finish and Linked |
| Total Float | Neg, 0, 1 to 5d, 6 to 20d, 21 to 44d and above 44d |
| Remaining Duration | 0 to 5d, 6 to 20d, 21 to 44d, 45 to 90d and above 90d |
| Schedule Density | Activity count per month, annotated with the peak |
Total Float is the chart to read alongside the High Float card. The card gives one percentage; the chart shows whether the float is spread across the schedule or piled into a single bucket above 44 days, which points at a specific missing link rather than a general logic problem.
What each check means and how it is worked out
The KPI Info button in the title bar opens a reference covering every check, each with a What it tells line and a How calculated line stating the exact numerator and denominator.
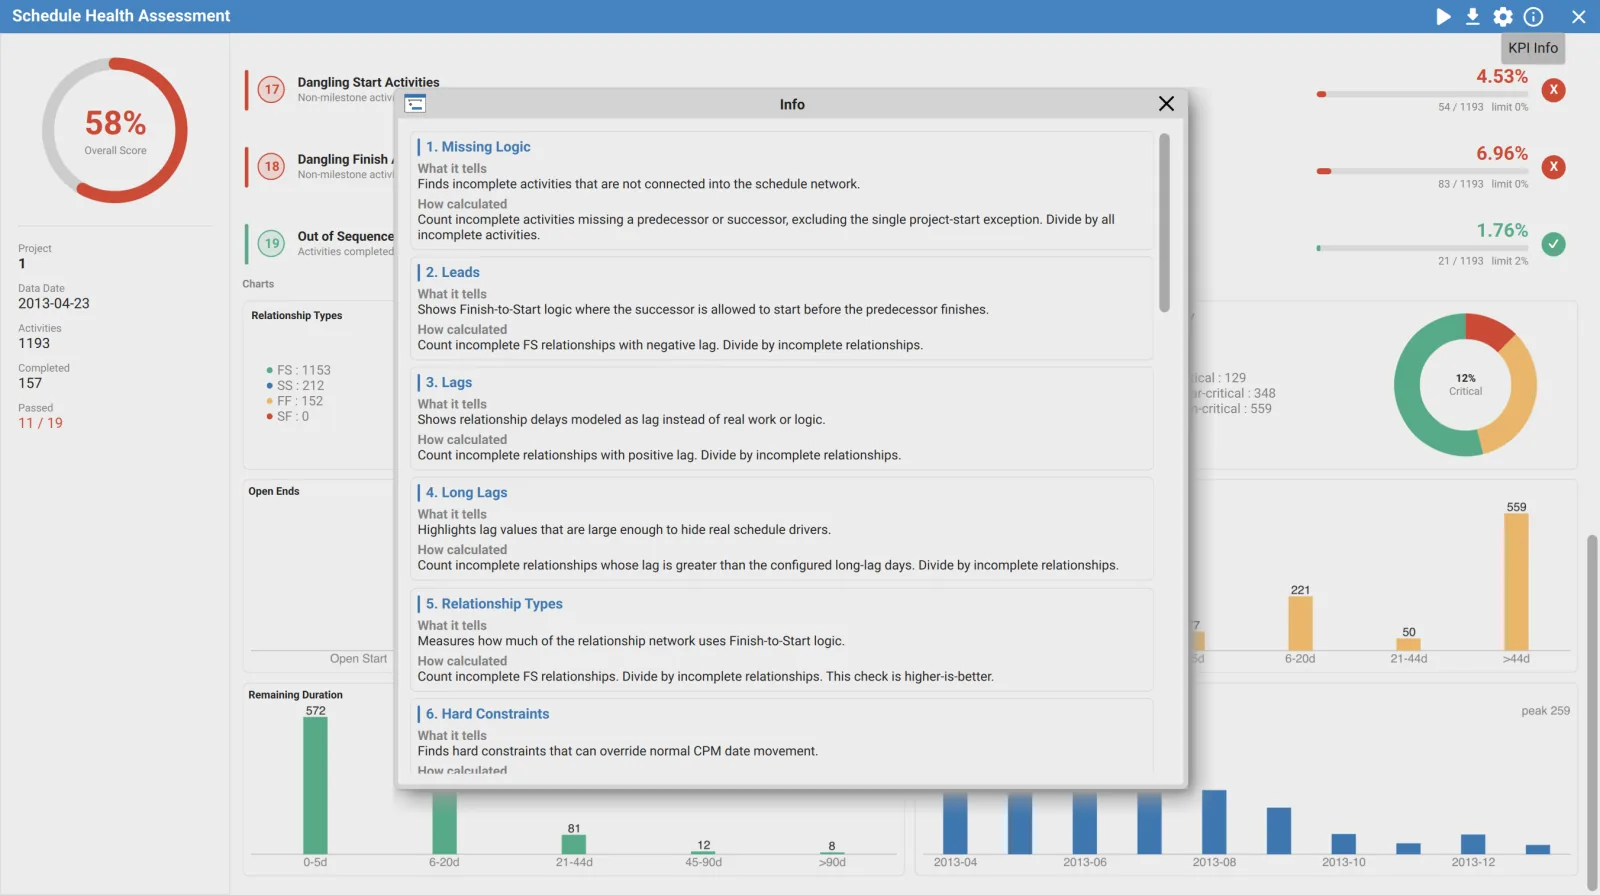
The title bar buttons
| Button | Effect |
|---|---|
| Run | Re runs the analysis. Disabled while a run is in progress |
| Export PDF | Writes the full assessment report. Disabled until an analysis has completed |
| Parameters | Opens the threshold settings |
| KPI Info | Opens the reference described above |
| Close | Returns to the activity view |
The buttons carry no captions. Hover one to see its name.
Changing the thresholds
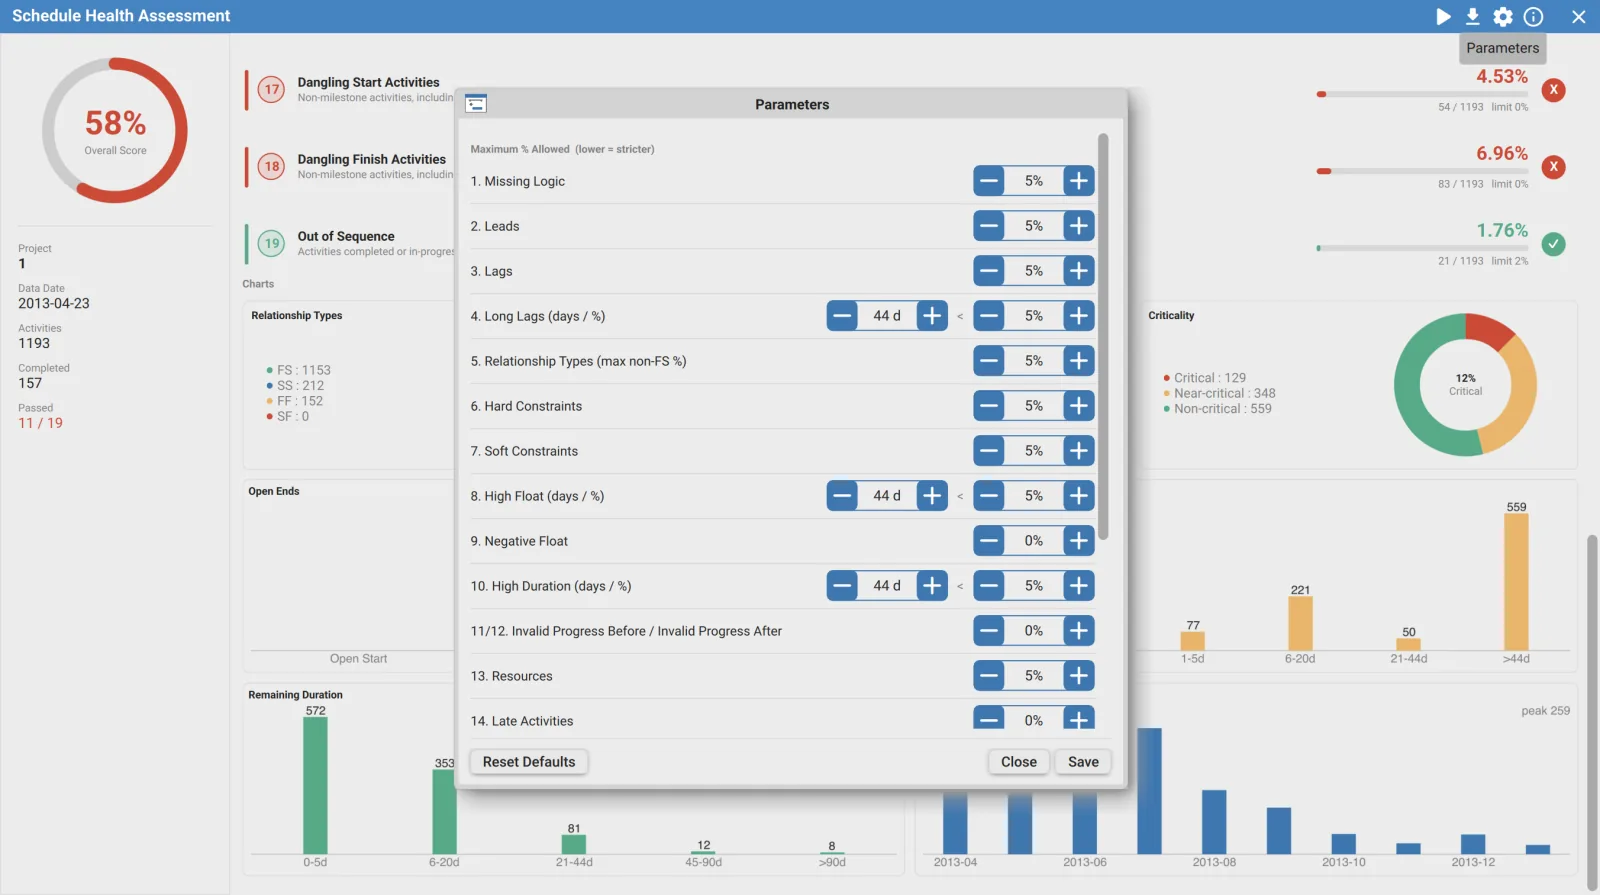
Parameters opens Maximum % Allowed (lower = stricter), one row per check.
| Row type | Fields |
|---|---|
| Single | One percentage limit |
| Long Lags, High Float, High Duration | A day count and a percentage. The day count defines what counts as long, high or excessive; the percentage is how many of those the schedule may contain |
| 11/12 | Invalid Progress Before and Invalid Progress After share one limit |
| CPLI, BEI | A minimum rather than a maximum |
| Default | Value |
|---|---|
| Most percentage limits | 5% |
| Negative Float, Invalid Progress, Late Activities, Dangling Start, Dangling Finish | 0% |
| Out of Sequence | 2% |
| Long lag, high float and high duration day counts | 44 days |
| CPLI and BEI minimum | 0.95 |
Saving parameters does not re run the analysis. The cards keep showing the result from the previous run against the previous limits. Press Run after Save or the score you are reading is not the one your new thresholds produce.
Reset Defaults restores the supplied thresholds. Close leaves without saving.
Analysing one project out of several
When the file holds more than one project, a project selector appears in the title bar to the left of Run. It is a checklist, not a single choice: tick the projects to include and the button label reports the selection as All Projects, a project name, or a count.
On a file with a single project the selector is hidden, because there is nothing to choose. Every project is ticked when the view opens, so the first run always covers the whole file.
Unticking the last remaining project is refused. The analyzer keeps at least one project selected, so you cannot arrive at an empty run.
The PDF report holds more than the screen
Export PDF writes a report named ScheduleAssessment.pdf by default, in these sections.
| Section | Content |
|---|---|
| Executive Summary | Score and headline figures |
| Schedule Logic Quality | The logic checks grouped together |
| Detailed Metrics | Every check with its value, limit and status |
| Charts | The same seven charts |
| Recommendations | The failing checks only, ordered by severity, each with the corrective action |
| Check Methodology | The calculation behind each check |
| Analysis Parameters | The thresholds the run used |
| Activity Details | The activities that failed each check, listed by ID |
Activity Details is the reason to export. The on screen cards give you a count; the report names the activities behind it, plus separate tables for out of sequence progress and external cross project links. Each table stops at 200 rows, and a heading ending in a plus sign means the check found more than were printed.
Recommendation severity is worked out from how far the value sits from its limit: at or beyond twice the limit, or below 80 percent of the minimum on the higher is better checks, a failure is ranked above the rest and printed first.
Requirements
Requires an open schedule with data and a signed in account. Clicking Schedule Analyzer while signed out opens the sign in dialog instead.