
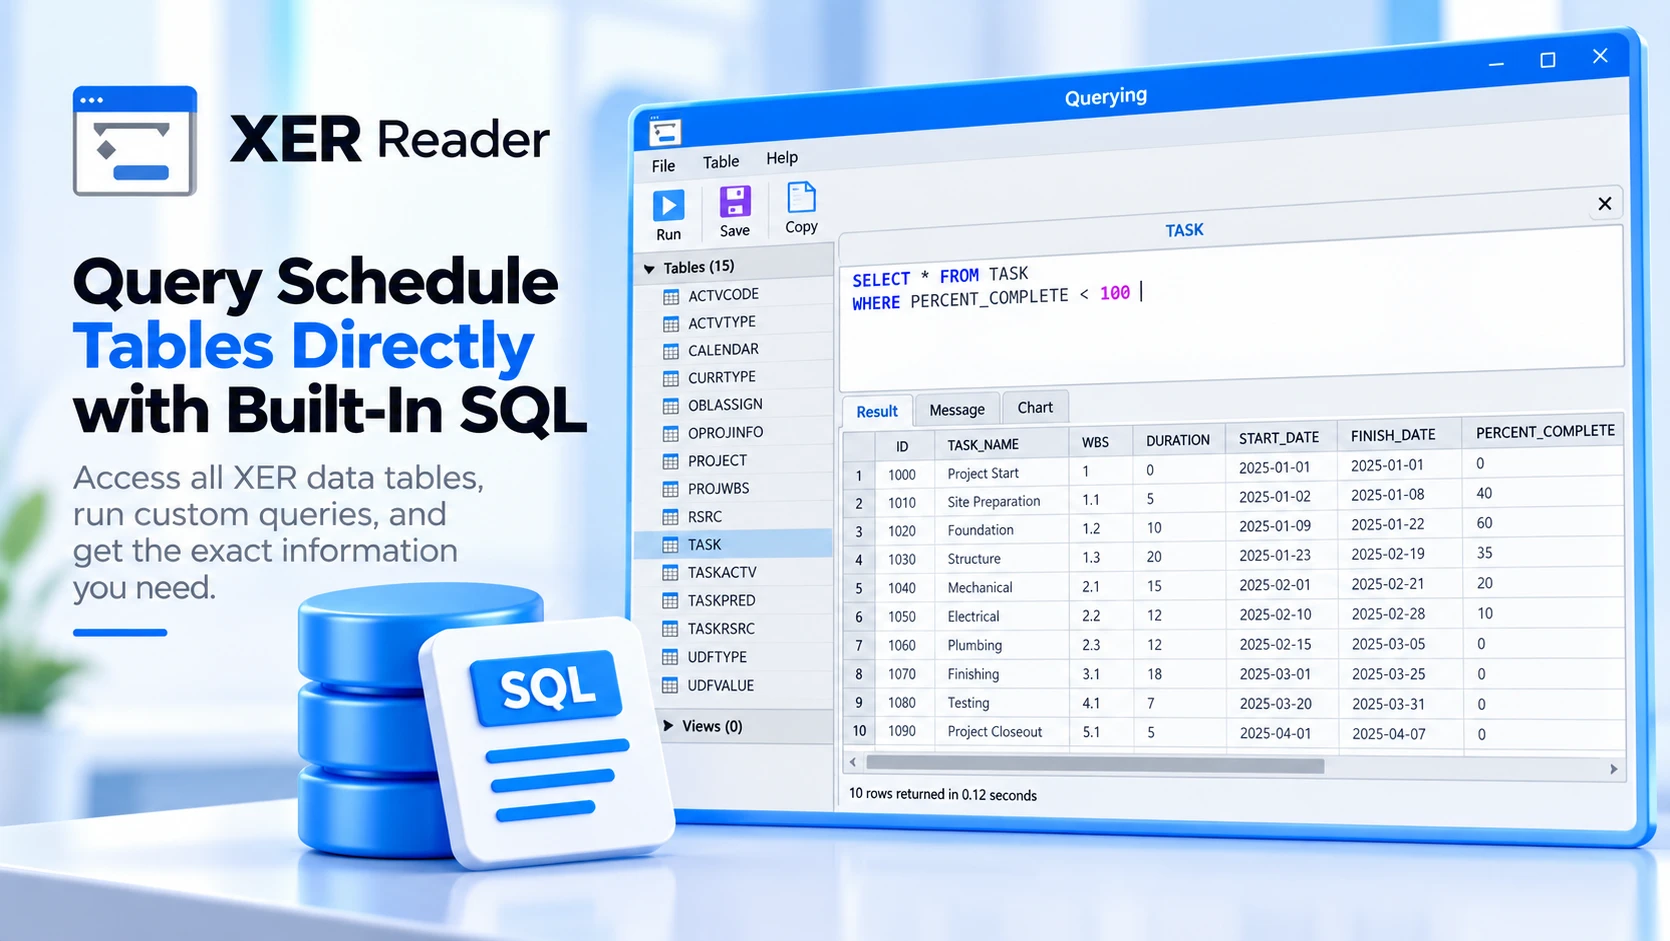
Querying gives you SQL against the converted schedule database: the P6 tables as they are, joinable, groupable and chartable. It is on the Tools tab, under Querying.
What it is pointed at
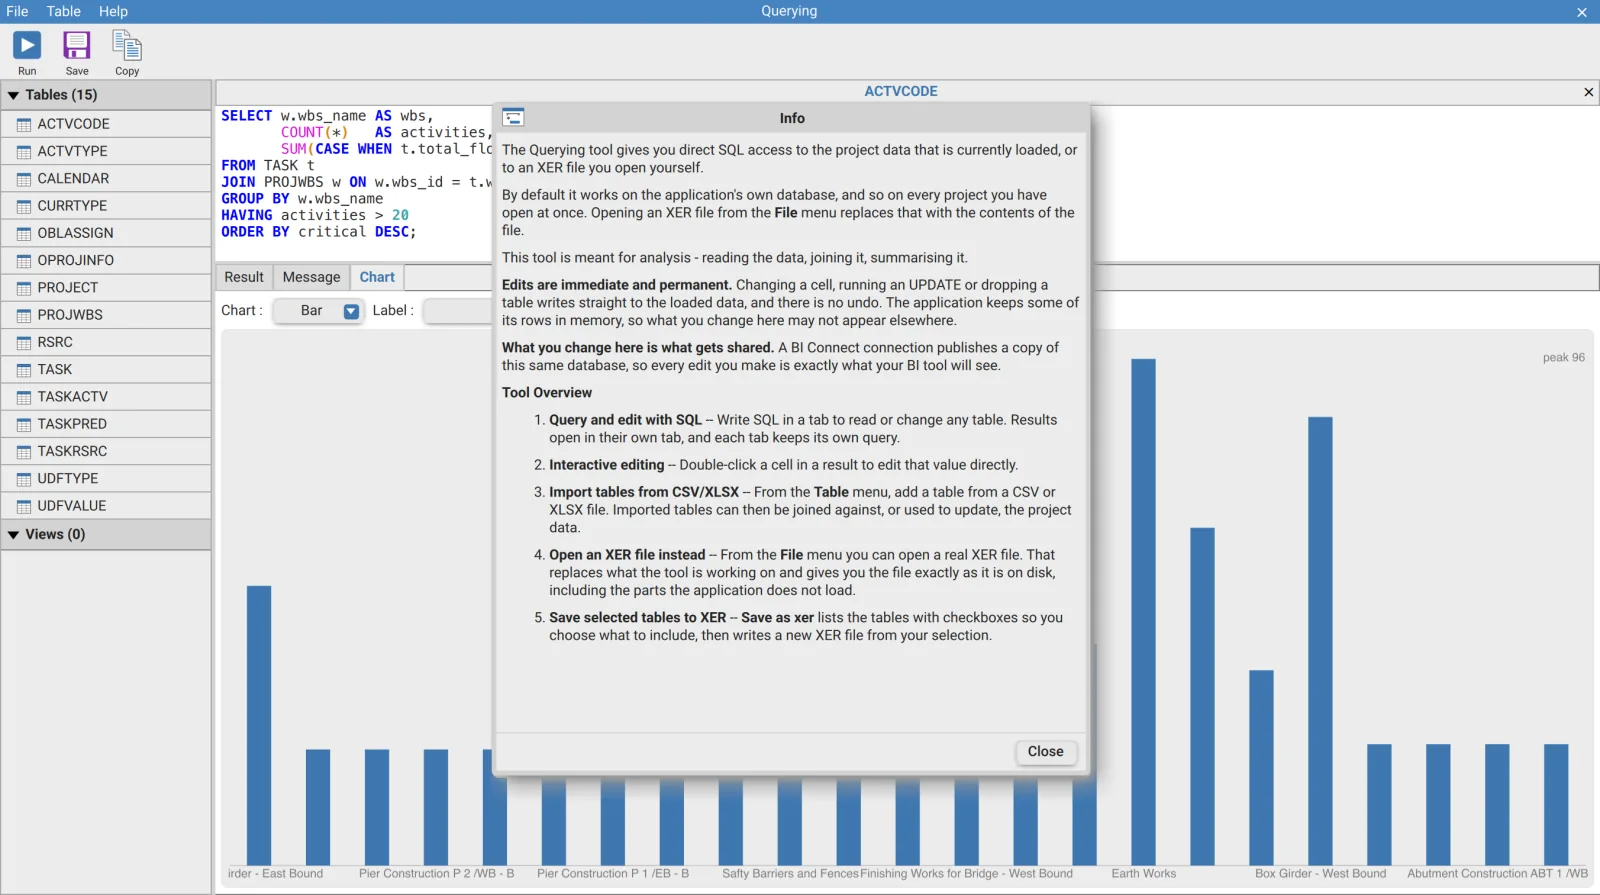
The tool opens on the application's own database, which holds every project currently open. The dialog's own Info page states it: "By default it works on the application's own database, and so on every project you have open at once. Opening an XER file from the File menu replaces that with the contents of the file."
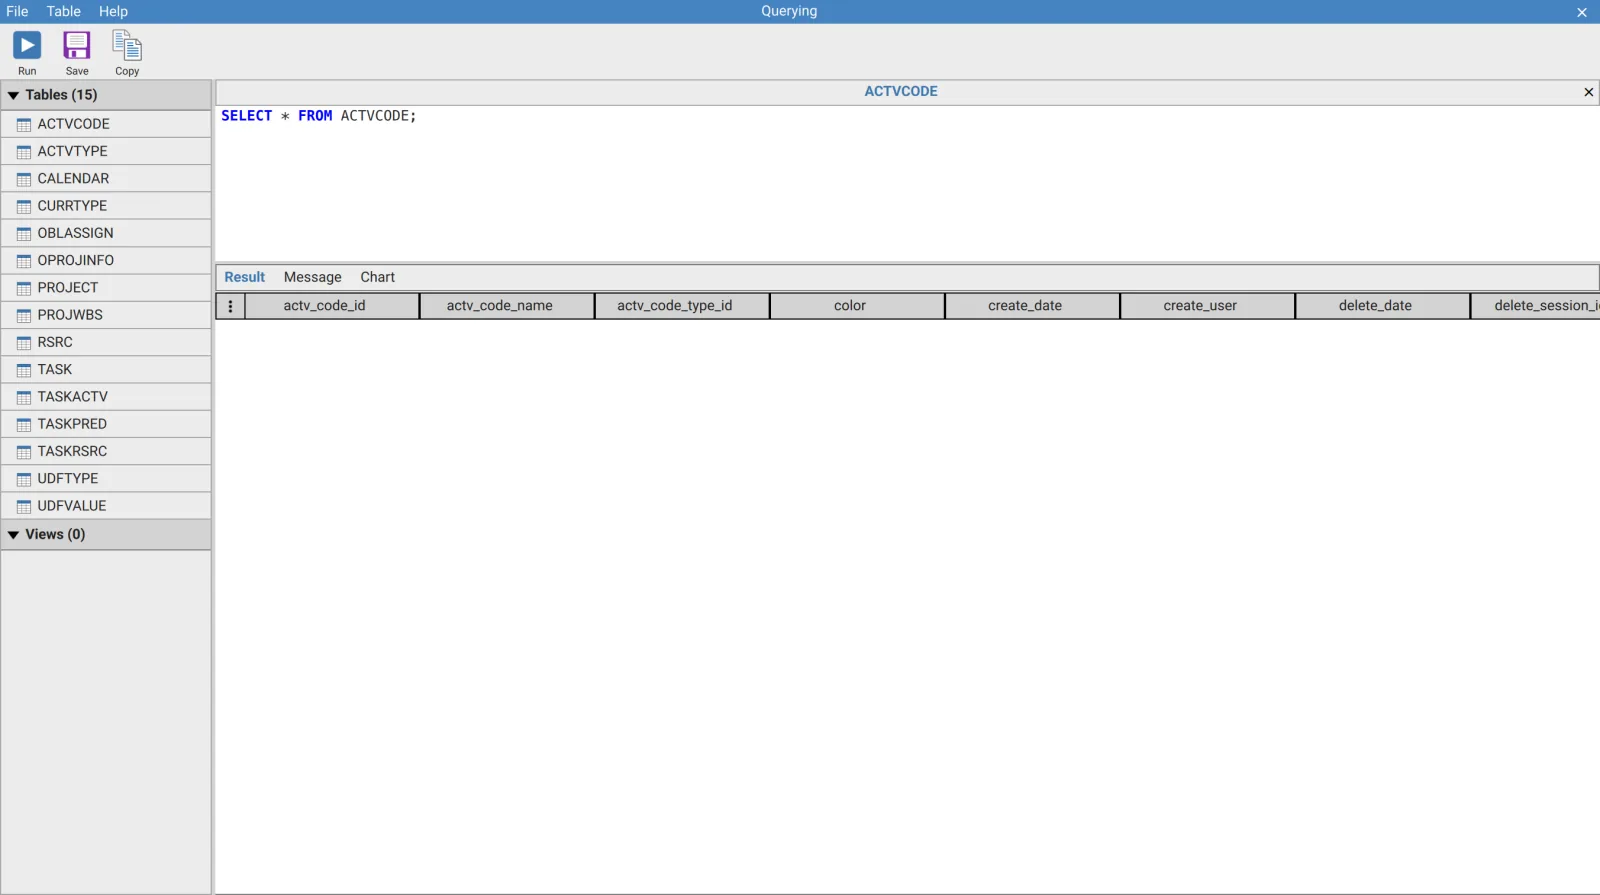
| Area | Contents |
|---|---|
| Menu bar | File, Table and Help |
| Toolbar | Run, Save and Copy |
| Sidebar | Tables and Views, each with a count and a collapse arrow |
| Query pane | One tab per query, with SQL syntax highlighting |
| Result pane | Result, Message and Chart |
Both split handles drag: the one between the sidebar and the query pane, and the one between the query and its result.
Opening a table
The first table opens in a tab on its own when the view loads. To open another, double click it in the sidebar. A single click only selects it.
Double clicking writes SELECT * FROM <name>; into a new tab and runs it. The tab keeps the name it was opened with even after you rewrite the query inside it, so a tab labelled TASK may be running something else entirely.
Reading a large table blocks the window while every row is fetched. The sidebar marks the object being read, and a second double click is ignored until the first has finished. That is the wait, not a hang.
Running a query
Run on the toolbar executes the active tab.
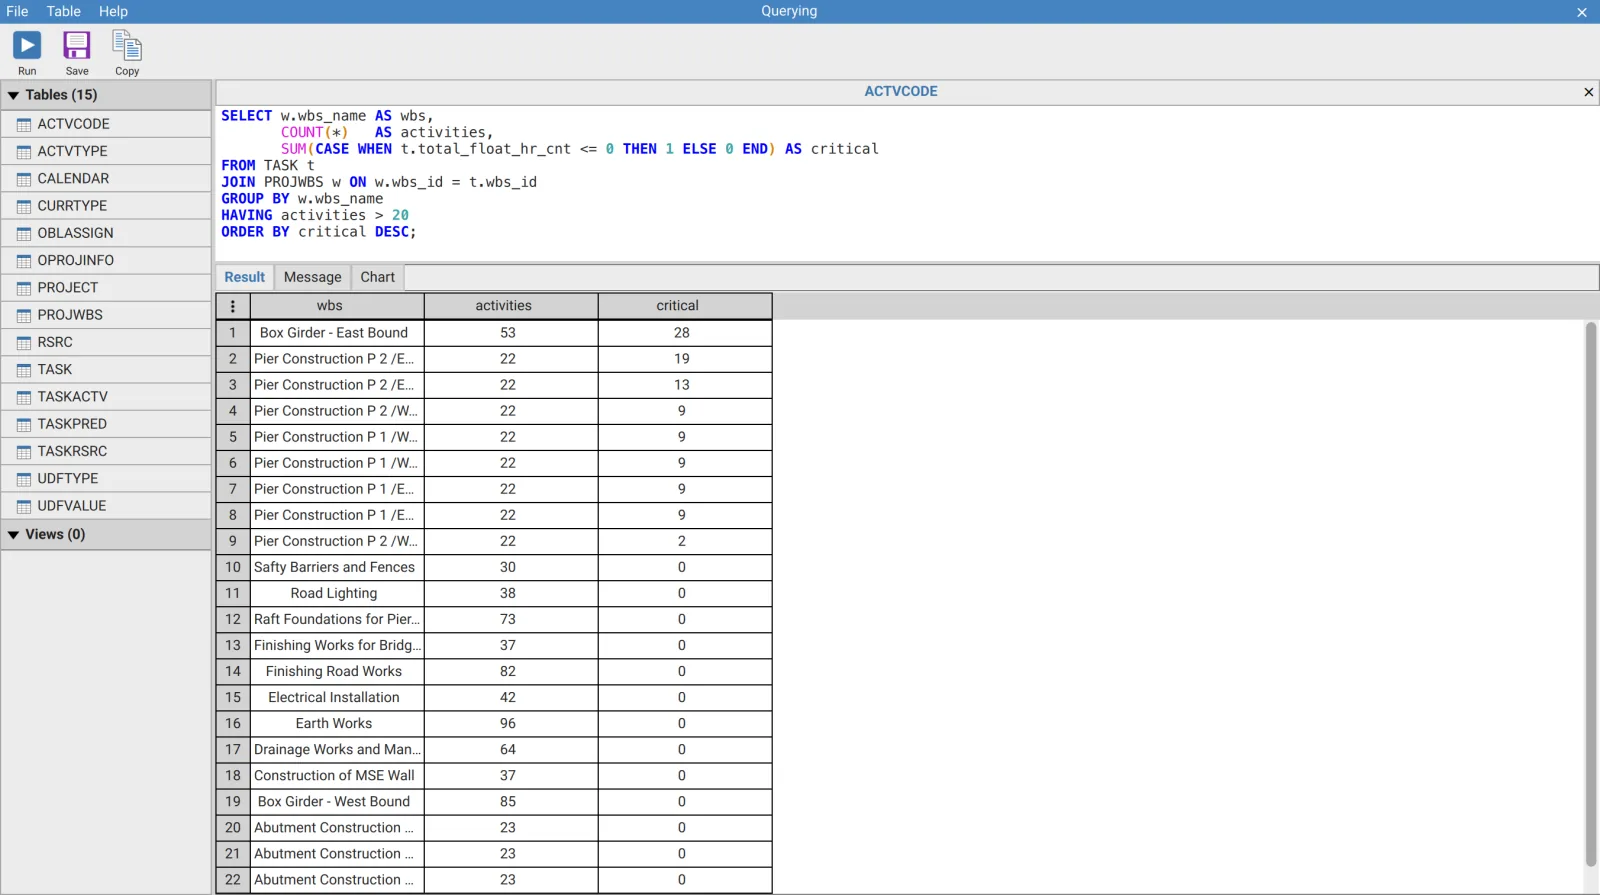
Select part of the query and only that part runs. With a selection in the editor, Run executes the selected text; with no selection it executes the whole tab. That is how to keep several statements in one tab and run them one at a time.
Several statements separated by semicolons run in order. The grid shows the last result set and the status line reports the last statement. The first statement that errors stops the batch, and nothing after it runs.
The three result tabs
| Tab | Shows |
|---|---|
| Result | The rows the query returned |
| Message | The status line, for example Query Executed, Rows Affected 1193, or the error text in red |
| Chart | A plot of the current result |
A successful run jumps to Result; an error jumps to Message. The one exception is deliberate: if you are sitting on Chart while editing the query, a successful run leaves you there so you can watch the plot change.
Editing a value in the result
Double click a cell in the result grid to edit it.
Cell editing only works on a plain single table SELECT. A result has to be traceable back to one real table before a change can be written to it, so anything with a join, a GROUP BY or an aggregate is read only, and so is every result from a view. If double clicking a cell does nothing, the query is the reason.
Charting the result
The Chart tab plots the rows the query returned, with three controls.
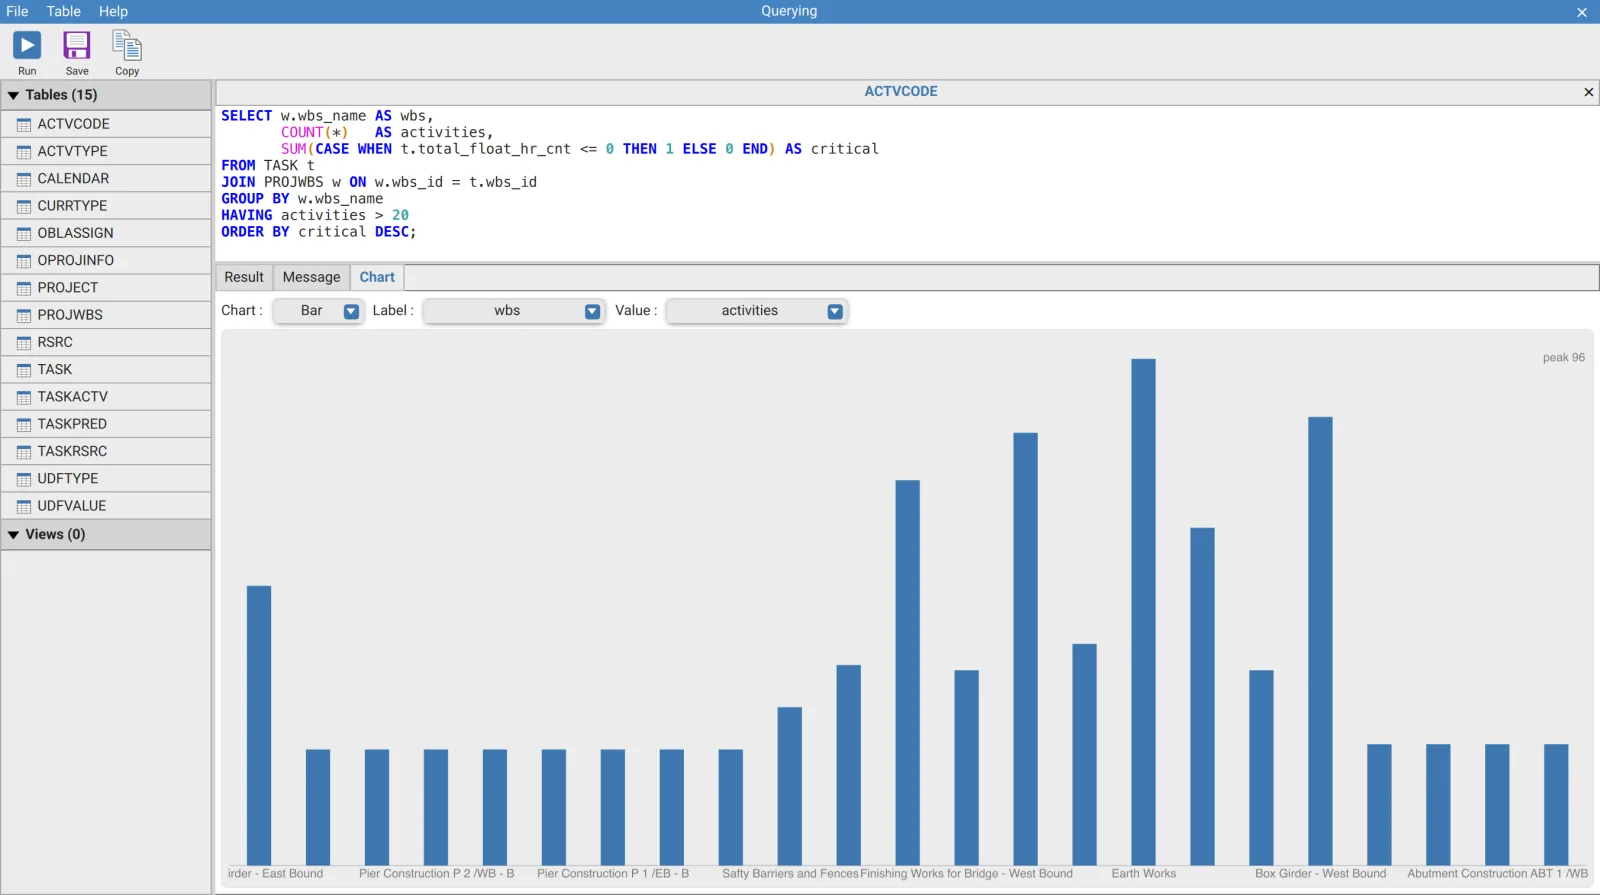
| Control | Options |
|---|---|
| Chart | Bar, Line or Donut |
| Label | The column that names each point |
| Value | The column that is measured |
With no choice made, the first column becomes the label and the second the value, so a chart appears the moment you open the tab. The choices are remembered by column name, so re running a query that adds or reorders columns keeps plotting the columns you picked rather than silently switching to different ones.
There is no pivot or aggregation in the chart. It plots the rows exactly as the query returned them, so the summarising has to be done in the SQL with GROUP BY. The tab says so itself when empty: "use GROUP BY in the query itself to summarise."
Only the first 200 rows are plotted. When the result is longer, the tab says showing first 200 of N rows in amber beside the controls rather than quietly truncating.
Objects the tool will not let you change
A small number of objects in the database are reserved by the application. Some of them refuse to be written to, and some refuse to be used at all, including reusing their name for a table or view of your own.
Nothing fails silently. A statement that touches a reserved object is refused with a message naming the object and saying why, so there is no need to know the list in advance. If a query is rejected for a table you did not expect, read the message rather than rewriting the SQL.
Edits are permanent
The Info page states the risk in the application's own words: "Edits are immediate and permanent. Changing a cell, running an UPDATE or dropping a table writes straight to the loaded data, and there is no undo. The application keeps some of its rows in memory, so what you change here may not appear elsewhere." There is no confirmation step either. Run a SELECT with the same WHERE clause before you run the UPDATE.
What you change here is what a BI tool receives. Also from the Info page: "A BI Connect connection publishes a copy of this same database, so every edit you make is exactly what your BI tool will see."
Working on a file instead of the open projects
File then Open xer file points the tool at an XER on disk instead of the loaded projects. That gives you the file exactly as it is, including the parts the application does not load when it opens a schedule normally. It replaces what the tool is working on, and every open query tab is rebuilt for the new database.
Writing an XER back out
File then Save as xer, or Save on the toolbar, opens a table picker.
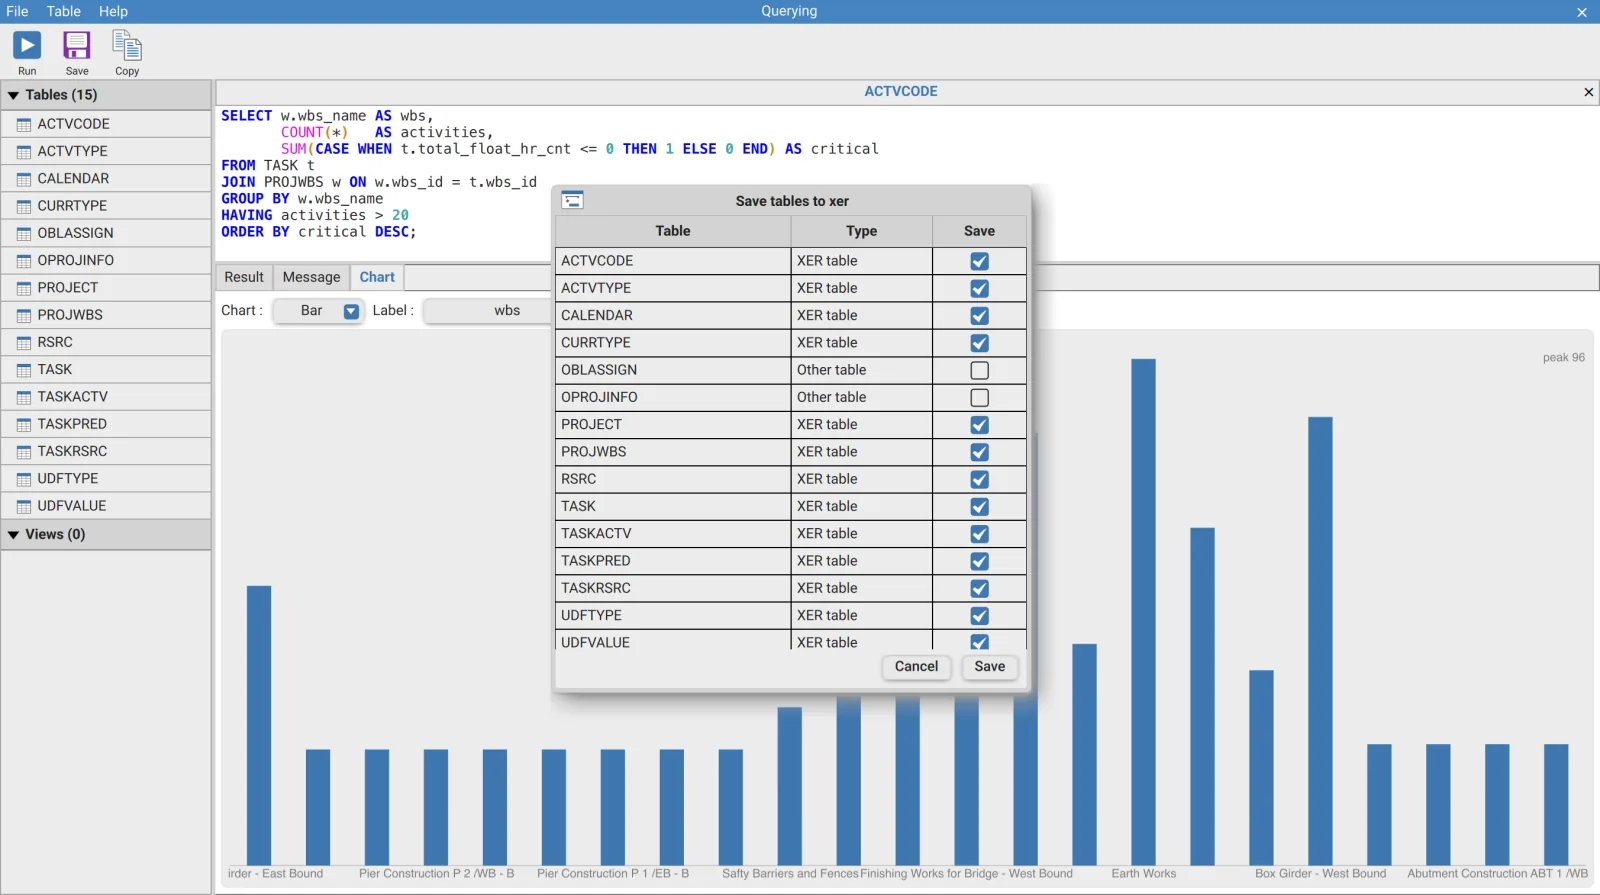
| Column | Meaning |
|---|---|
| Table | The table name |
| Type | XER table for part of the P6 schema, Other table for anything else, including tables you imported |
| Save | Whether it is written to the file |
Only XER tables are ticked when the dialog opens. A table you imported from CSV or XLSX shows as Other table and is left out unless you tick it. So are the objects the application reserves for itself. Check the ticks before saving rather than after.
Copying a result out
Copy on the toolbar puts the active tab's result on the clipboard as tab separated values, which pastes into a spreadsheet with the columns intact.
Autocomplete
A completion list opens as you type a word in the query editor. It offers SQL keywords along with the table names, view names and column names of the database currently loaded, so the schema does not have to be memorised. Escape closes it.
Adding external data
The Table menu holds Add table from csv and Add table from xlsx, which bring an outside file in as a table you can join against or update the project data from.
Requirements
Requires an account entitled to the editor, and is unavailable while in shared mode.